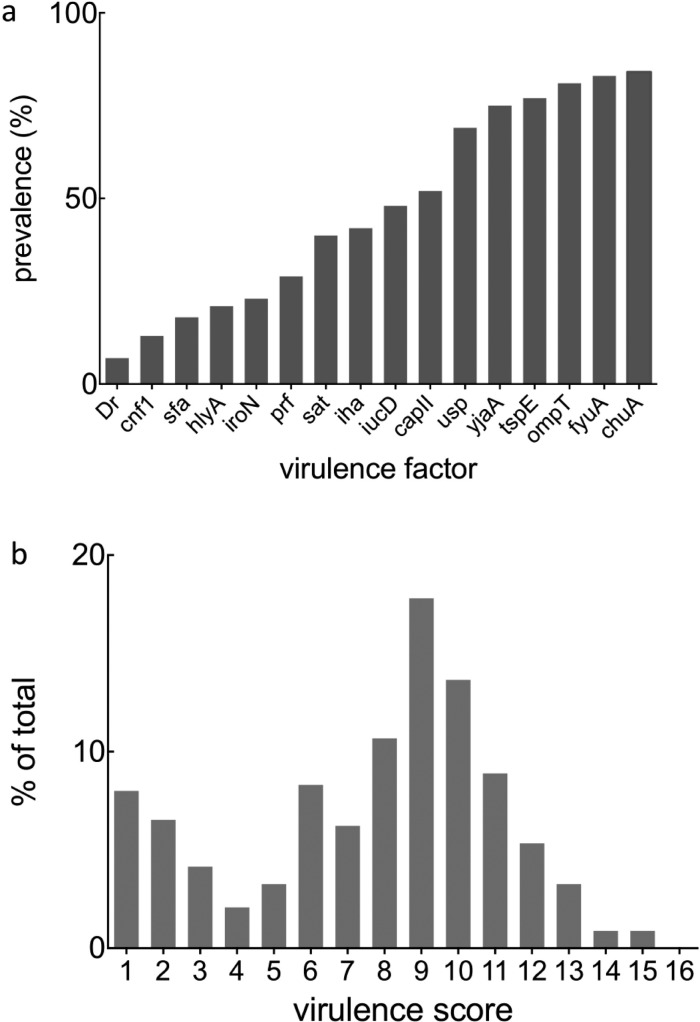
Figure 1.
Virulence factor incidence and distribution among the clinical isolates examined in this study: (a) Virulence factor incidence in the 337 clinical isolatesi shown. (b) Each virulence factor (VF) was assigned a score of 1. Any virulence score ≥1 indicates the presence of one or more VFs, and 0 is the absence of individual genes. Because the presence and absence of all 16 genes were considered, the VF score ranged from 0 to 16. Next, a data matrix was generated to determine each clinical isolate’s VF profile. A bimodal distribution of virulence scores was observed among 337 clinical isolates, with local maxima at one and nine virulence factors.

