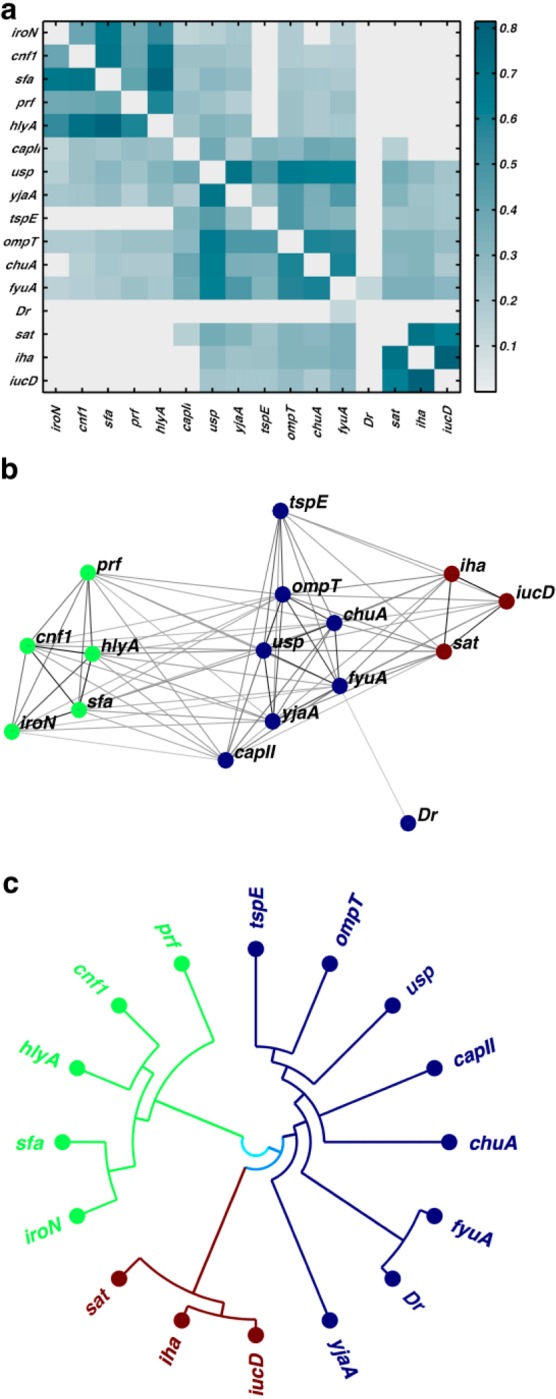
Figure 2.

Network community detection clusters 16 virulence factors into three discrete communities. (a) Three VF communities are evident in an empirical heatmap depicting statistically significant positive correlations between VFs. (b) A force-directed layout illustrates connectivities between individual virulence factors (VFs) organized into three VF communities (colors). (c) Nested hierarchy of communities of VF genes in a polar coordinate dendrogram are colored according to community identification at default resolution (three communities). Each VF community contains a distinct siderophore gene (iroN, fyuA, iucD).
