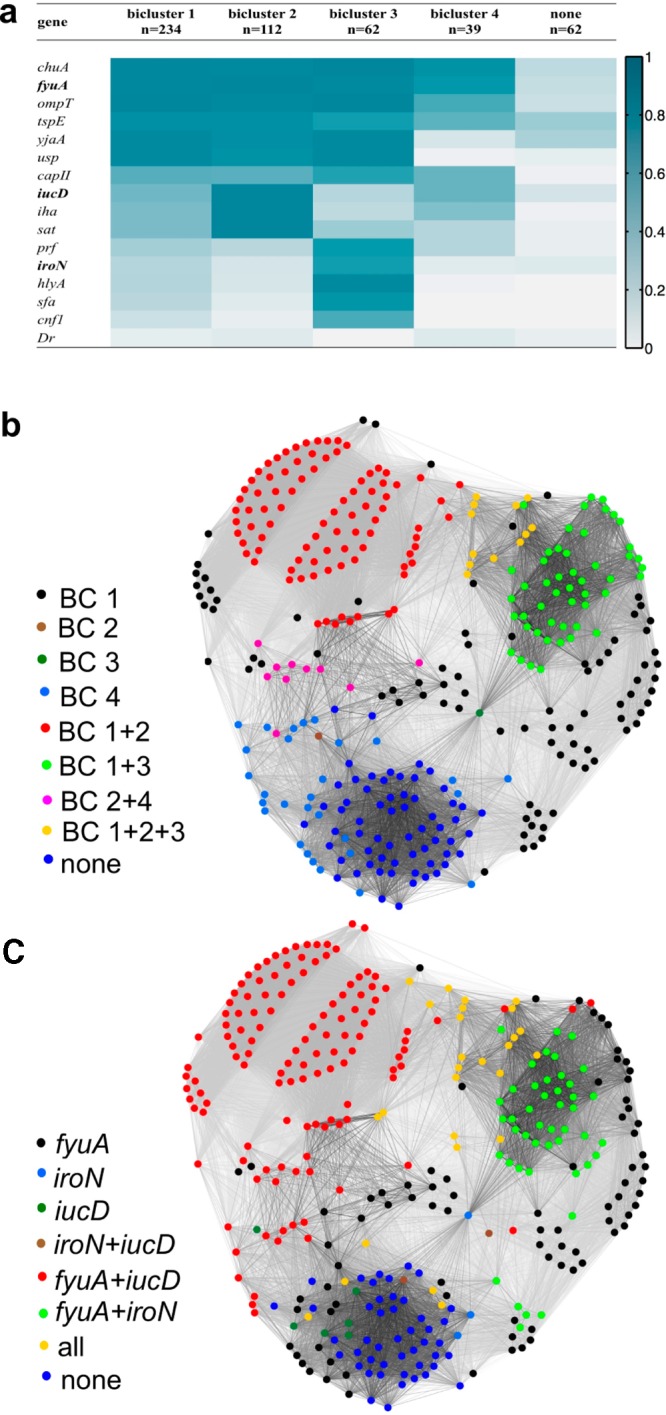
Figure 4.

Bicluster and siderophore gene composition cluster clinical isolates similarly to network analysis. (a) Four biclusters describe 82% of the CIs in this population. Siderophore genes are in bold type. Color scale: dark blue, VF presence = 100%; white, ≤5%. (b, c) The force-directed layout for clinical isolates overlaid with each CI’s bicluster assignments (b) and siderophore genotype (c) illustrates overall similarities between these CI classification approaches and the communities in Figure 1b.
