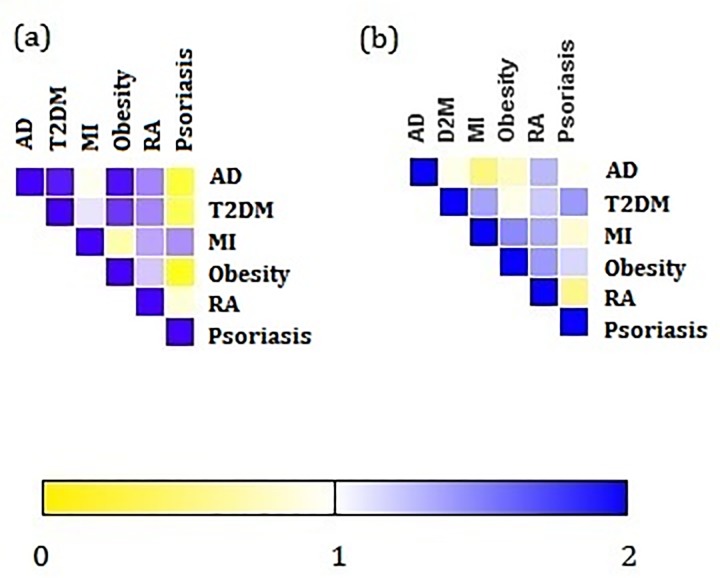
Fig 9. Similarity between psoriasis and its comorbidities.
Each cell is colored according to the Jaccard correlation coefficient which represents the similarity between the comorbidities considering, (a) biological process and (b) biological pathways. The MI shares the highest JC in biological process with psoriasis and T2DM shares the highest JC in pathway annotation

