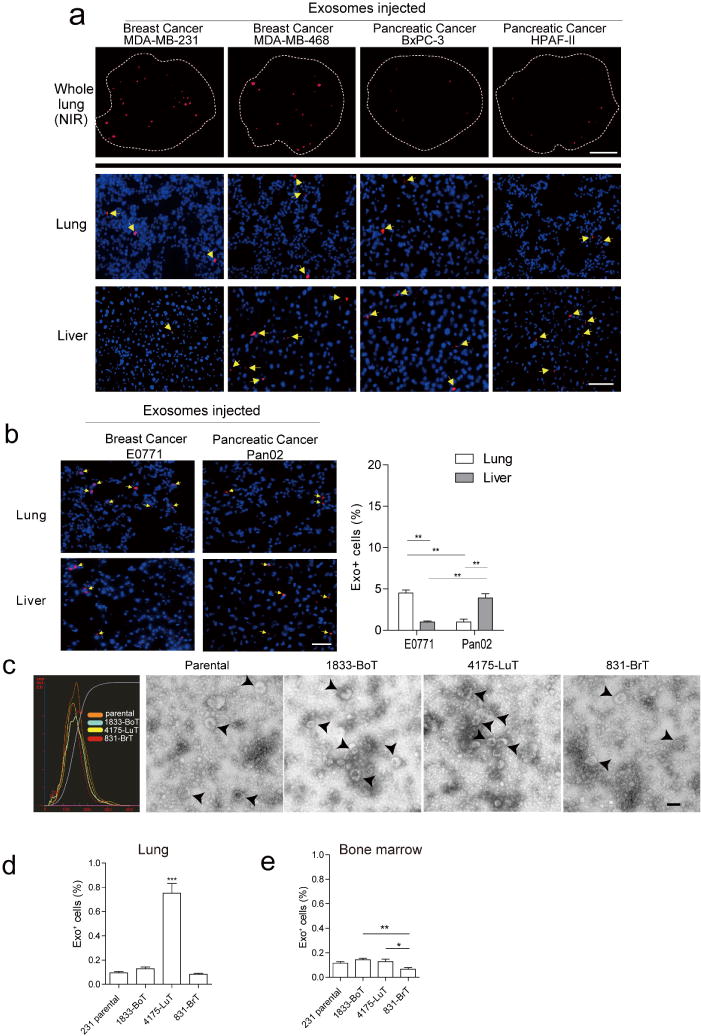
Extended Data Figure 1. Characterization of organotropic exosome properties and biodistribution.

a, Human cancer exosome biodistribution in lung and liver. Exosomes (10 μg) derived from each cell line were labelled with lipophilic PKH26 dye (red) and injected retro-orbitally into nude mice 24 h before culling. Top, representative NIR whole-lung image by Odyssey imaging (n = 3). Middle and bottom, represent exosome biodistribution in the lung and liver as determined by immunofluorescence microscopy. Arrows indicate exosome foci (n = 3, three independent experiments). b, Biodistribution of exosomes isolated from mouse cell lines E0771 and Pan02. Mouse exosome biodistribution in the lung and liver was determined by immunofluorescence microscopy. Exosomes (10 μg) derived from each cell line were labelled with lipophilic PKH26 dye (red) and injected retro-orbitally into nude mice 24 h before culling. Top, lung at 40 × magnification. Bottom, liver at 40 × magnification. Arrows indicate exosome foci. Graph represents the quantification of exosome distribution by counting exosome-positive cells. An average of five random fields per sample were counted at 20 × magnification (three independent experiments, each with n = 3). ** P < 0.01 by two-tailed Student’s t-test. c, Analysis of organotropic cell-derived exosomes. MDA-MB-231 organotropic cell-line-derived exosomes were analysed for size distribution by NanoSight and phenotype (purity and shape) by electron microscopy; black arrows indicate representative exosomes. Technical triplicates were analysed, at least 10 images per sample. d, Flow cytometric analysis of exosome+ cells in lung. Exosomes (10 μg) derived from MDA-MB-231 organotropic cell lines were labelled with lipophilic PKH67 dye (green) and injected retro-orbitally into nude mice 24 h before culling. FITC-channel-positive cells were acquired on a FACS Calibur, and the percentage of exosome-positive cells was quantified (representing data pooled from two independent experiments, a total of n = 12). ***P < 0.001 by one-way ANOVA. e, Flow cytometric analysis of exosome-positive cells in the bone marrow. Exosomes (10 μm) derived from MDA-MB-231 organotropic cell lines were labelled with lipophilic PKH67 dye (green) and injected retro-orbitally into nude mice 24 h before culling. FITC-channel-positive cells were acquired on a FACS Calibur, and the percentage of exosome-positive cells was quantified (representative data pooled from two independent experiments, a total of n = 6). ** P < 0.01 and *P < 0.05 by one-way ANOVA for the 831-BrT to 1833-BoT and 4175-LuT comparisons, respectively. Data are mean ± s.e.m. Scale bars, 5 mm (a, top), 50 μm (a, middle and bottom, b) and 100 nm (c).
