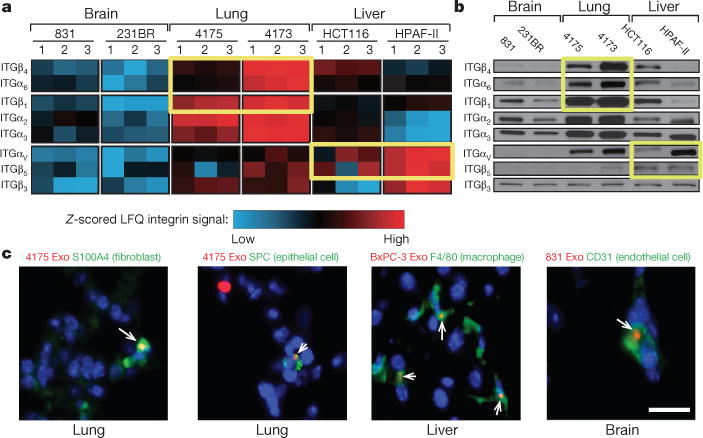
Figure 2. Organ-specific tumour exosomes interact with resident cells.

a, Heat map of integrin signals from quantitative mass spectrometry analysis, based on Z-scored label-free quantification (LFQ) values (technical triplicates). b, Western blot analysis of integrins from organotropic cell-line-derived exosomes, representative of three independent experiments. For western blot source data, see Supplementary Fig. 1a–h. c, Analysis by immunofluorescence of exosome distribution (red) and different resident cell types (green). Left to right: lung co-staining with 4175-LuT exosomes and S100A4 (fibroblasts) or SPC (epithelial cells), liver co-staining with F4/80 (macrophages) and BxPC-3-LiT exosomes, and brain co-staining with CD31 (endothelial cells) and 831-BrT exosomes. Scale bar, 30 μm. Immunofluorescence images are representative of five exosome-positive cells e ach, f rom n = 5 mice.
