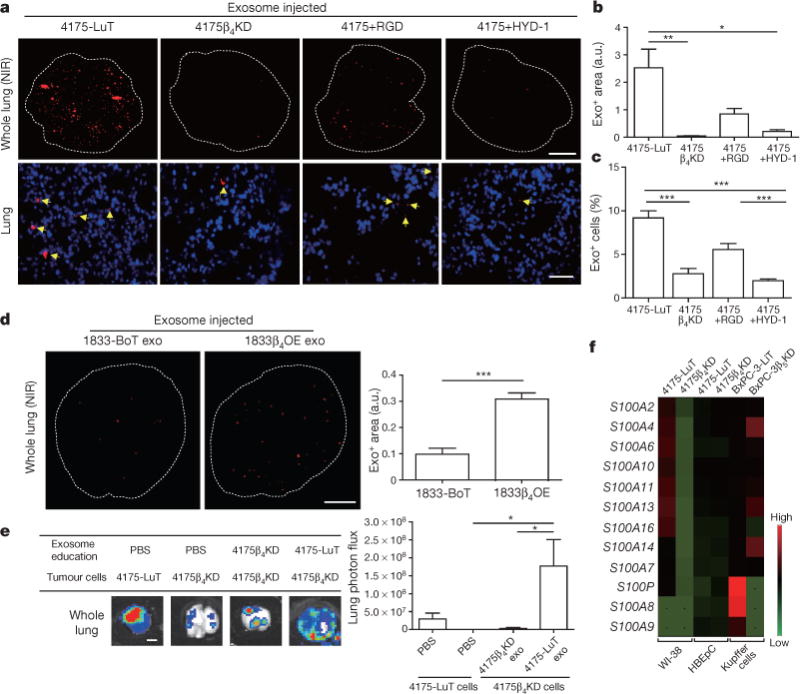
Figure 3. Exosomal ITGβ4 expression functionally contributes to 4175-LuT exosome localization and mediates lung metastasis.

a, Top, NIR whole-lung imaging of 4175-LuT- or 4175β4KD-derived exosomes, or 4175-LuT-derived exosomes pre-incubated with RGD or HYD-1 peptides. Bottom, fluorescence microscopy. Arrowheads indicate exosome foci. b, Quantification of exosome-positive areas from the whole-lung images in a (top) (n = 4, except 4175, in which n = 6). c, Immunofluorescence quantification of exosome-positive cells from a (bottom) (n = 6 pooled from two independent experiments). d, Left, NIR whole-lung imaging of 1833-BoT (n = 5) or 1833-BoT overexpressing ITGβ4 (1833β4OE) (n = 4) exosomes. Right, quantification of the exosome-positive areas. e, Experimental lung metastasis of 4175β4KD cells after education with wild-type or 4175β4KD exosomes. Bioluminescence imaging of lung metastasis and quantification of luciferase activity (n = 6, data representative of two independent experiments). f, Heat map of S100 gene expression fold change by quantitative reverse transcription PCR (qRT–PCR) in 4175-LuT or 4175β4KD exosome-conditioned lung fibroblast (WI-38) or epithelial (HBEpC) cells, and liver-tropic BxPC-3 or BxPC-3β5KD exosome-conditioned Kupffer cells. Red represents high and green represents low expression (n = 3 in two independent experiments). Scale bars, 5 mm (a, top, d, e) and 50 μm (b, bottom). Data are mean ± s.e.m. * P < 0.05; ** P < 0.01; *** P < 0.001 by one-way ANOVA (b, c, e); *** P < 0.001 by two-tailed Student’s t-test (d).
