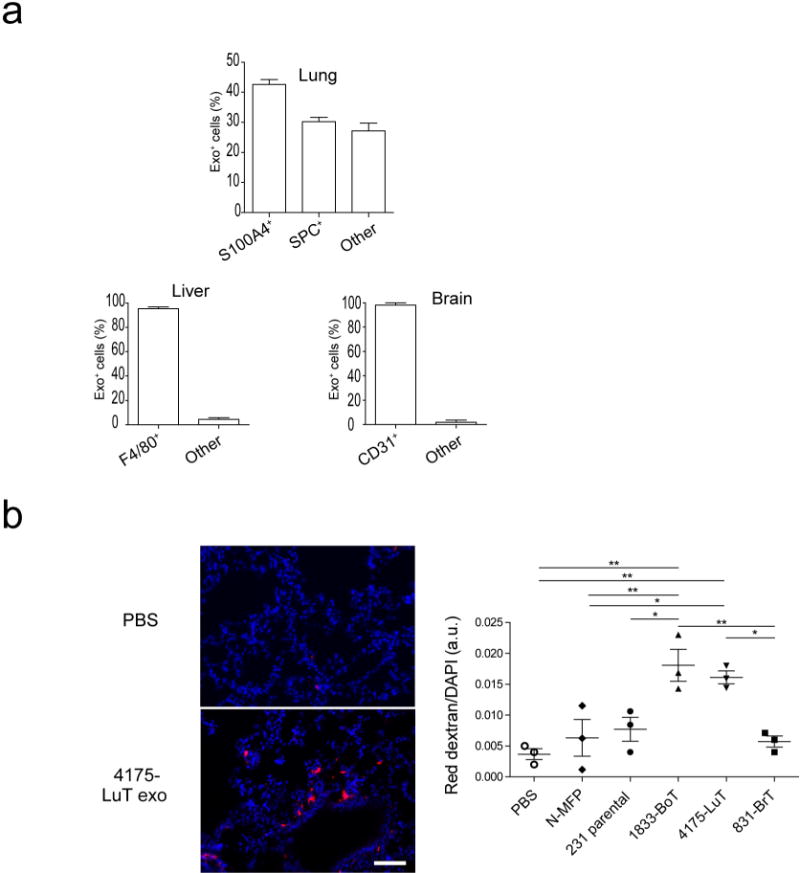
Extended Data Figure 4. Functional characterization of organotropic exosomes.

a, Quantification of organotropic exosome uptake by target cells in vivo. Top graph, flow cytometric quantification of the frequency of 4175-LuT exosome-positive fibroblasts and epithelial cells (n = 4). Left bottom graph, flow cytometric quantification of the frequency of BxPC-3 exosome-positive macrophages (n = 3). Right bottom graph, quantification of the frequency of 831-BrT exosome-positive endothelial cells by immunofluorescence microscopy (n = 5). b, Organotropic cell-line-derived exosomes induce vascular leakiness in the lung. Leakiness in the lung 24 h after retro-orbital injection of 10 μg of normal mammary fat pad or MDA-MB-231 organotropic cell-line-derived exosomes was quantified by imaging the presence of fluorescent dextran (red) outside of blood vessels, in the lung parenchyma. Left top panel, 40 × magnification of representative lung image after PBS injection. Left bottom panel, representative lung image after 4175-LuT exosome injection. Scale bar, 50 μm. Right graph depicts the quantification of five random areas at 20 × magnification in arbitrary units (data representative of two independent experiments; n = 3). Data are mean ± s.e.m. * P < 0.05; ** P < 0.01 by one-way ANOVA.
