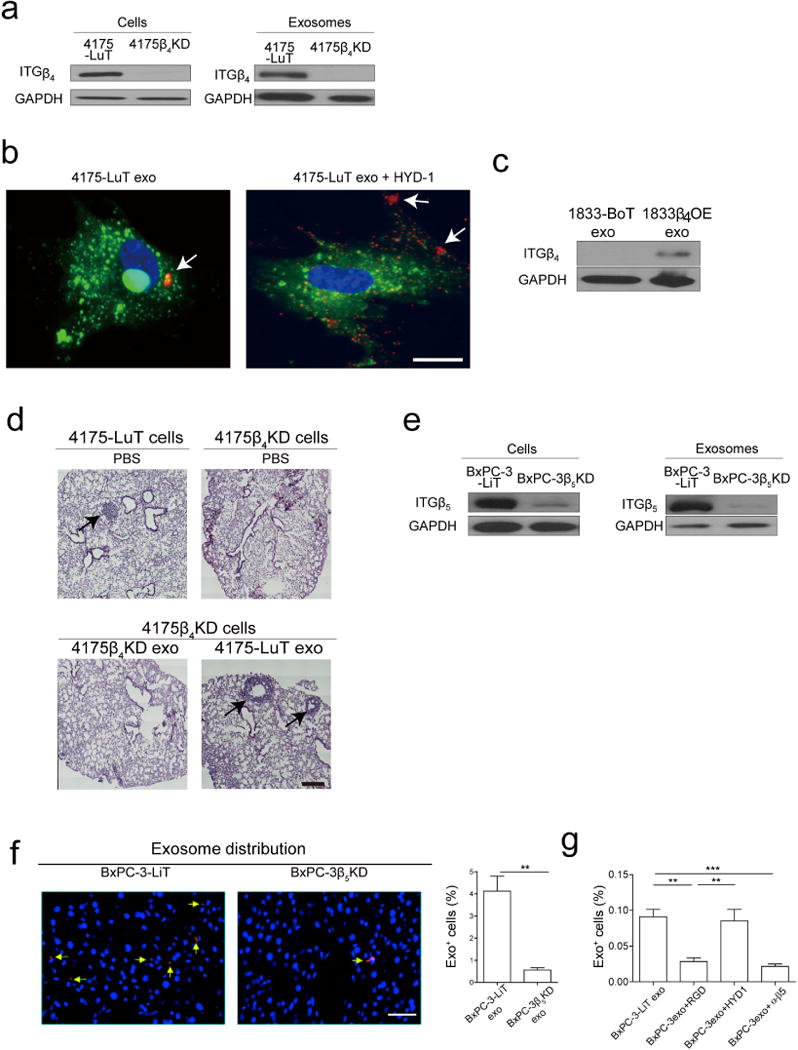
Extended Data Figure 6. ITGs functionally regulate organotropic exosome uptake and exosome-mediated metastasis.

a, Representative western blot analysis of integrin expression in 4175-LuT and 4175β4KD cells and exosomes (representative of three independent experiments). For western blot source data, see Supplementary Fig. 1l. b, In vitro uptake of 4175-LuT exosomes by WI-38 lung fibroblasts. The WI-38 cell membrane was labelled with PKH67 green dye and 4175-LuT exosomes were labelled with PKH26 red dye. Exosomes (10 μg ml−1) were first incubated with PBS or HYD-1 peptide for 30 min at 37°C, followed by 1-h incubation with WI-38 cel ls at 37°C. Excess exosomes were washed and cells were imaged (n = 4 for two independent experiments). c, Representative western blot of ITGβ4 expression in exosomes isolated from wild-type or ITGβ4-overexpressing 1833-BoT cells (representative of two independent experiments). For western blot source data, see Supplementary Fig. 1m. d, Representative haematoxylin/eosin staining of lungs from Fig. 3e. Arrows indicate lung metastasis; n = 6, data representative of two independent experiments. e, Representative western blot analysis of integrin expression in BxPC-3-LiT and BxPC-3β5KD cells and exosomes. For western blot source data, see Supplementary Fig. 1n. f, Immunofluorescence analysis of BxPC-3-LiT control and BxPC-3β5KD-derived exosome biodistribution in the liver. Exosomes (10 μg) isolated from each cell line were labelled with lipophilic PKH26 dye (red) and injected retro-orbitally into nude mice 24 h before culling. Left, 40 × magnification. Arrows indicate exosome foci. Scale bar, 50 μm. Right, quantification of exosome distribution by exosome-positive cells. An average of five random fields were counted at 20 × magnification (data representative of two independent experiments; n = 3). g, Flow cytometry analysis of exosome-positive cells in the liver 24 h after exosome injection. Labelled BxPC-3-LiT exosomes (5 μg) per mouse were incubated with PBS, RGD, HYD-1 or ITGαvβ5 antibody for 30 min at 37°C before retro-orbital injection into nude mice. Livers were collected and analysed for exosome-positive cells by flow cytometry 24 h after injection (n = 4, except for the ITGαvβ5 antibody group, in which n = 5). Scale bars, 10 μm (b), 500 μm (d) and 500 μm (f). ** P < 0.01, *** P < 0.001 by two-tailed Students t-test (f) and one-way ANOVA (g). Data are mean ± s.e.m.
