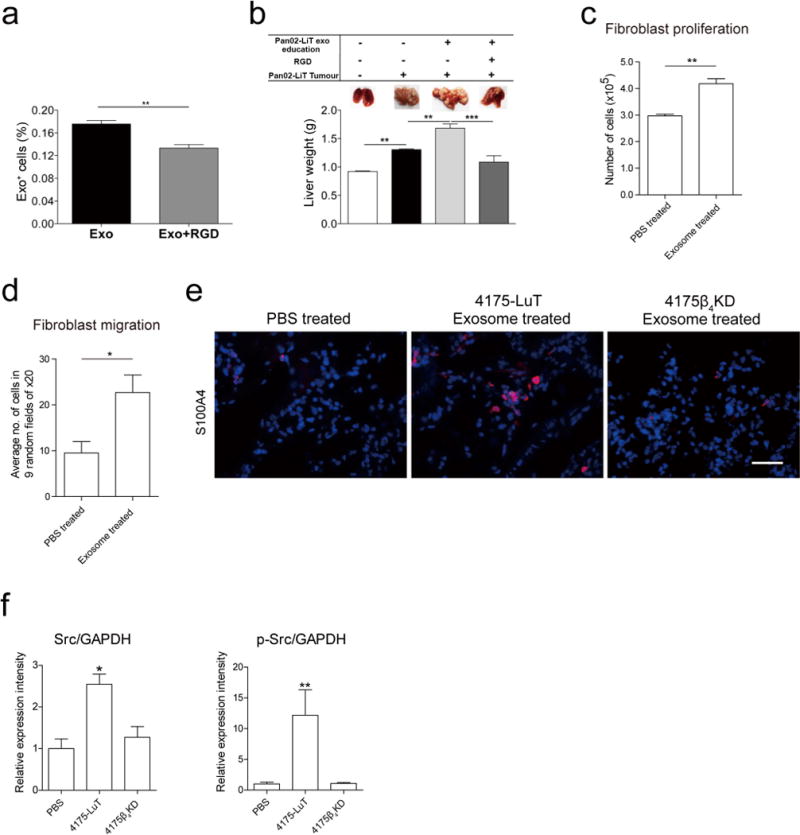
Extended Data Figure 7. Functional contribution of exosomes to metastasis.

a, Microscopic analysis of exosome-positive cells in the livers of mice injected with liver metastatic Pan02-LiT-derived exosomes. Before injection, Pan02-LiT exosomes were pre-incubated with RGD peptide for 30 min at 37°C. Pan02-LiT exosomes (10 μg) were labelled with lipophilic PKH67 green dye and injected retro-orbitally into C57BL/6 mice 24 h before culling. Livers were digested and exosome-positive cells were quantified by flow cytometr y (n = 3). b, Analysis of Pan02-LiT liver metastasis after 3 weeks of continuous treatment with PBS, Pan02-LiT-derived exosomes, or Pan02-LiT-derived exosomes pre-incubated with RGD peptide for 30 min at 37°C. Pan02-LiT cells were injected intrasplenically. Mice were injected retro-orbitally with 5 μg exosome every other day for 3 weeks. Top, representative liver images showing metastasis taken at culling. Bottom, liver weight quantification (n = 4 except for the control and peptide group for which n = 3 of one experiment). c, Functional analysis of lung fibroblasts educated with 4175-LuT-derived exosomes. Proliferation of lung fibroblasts educated with exosomes every other day for 2 weeks. Three days after cells were plated at equal density, cell numbers were counted using a haemocytometer (n = 3; three independent experiments). d, Migration of lung fibroblasts educated with exosomes every other day for 2 weeks was measured as follows. Fibroblasts were plated in 24-well transwell chamber inserts, and after 6 h the number of cells that migrated was counted using haematoxylin staining. Nine random fields were counted at 20 × magnification and the average number of cells per field was calculated (total of n = 4 from two independent experiments). e, Representative image of the lung stained for S100A4. Mice were treated every other day with PBS, 4175-LuT or 4175β4KD exosomes for 3 weeks. Scale bar, 50 μm; n = 4 mice. f, In situ (in-cell western) protein expression analysis of WI-38 fibroblasts treated with PBS, 4175-LuT or 4175ITGβ4KD exosomes. Relative expression levels of Src and phosphorylated (p-) Src (n = 3, three independent experiments). Data are mean ± s.e.m. * P < 0.05; ** P < 0.01; *** P < 0.001 by two-tailed Student’s t-test (a, c, d) and one-way ANOVA (b, f).
