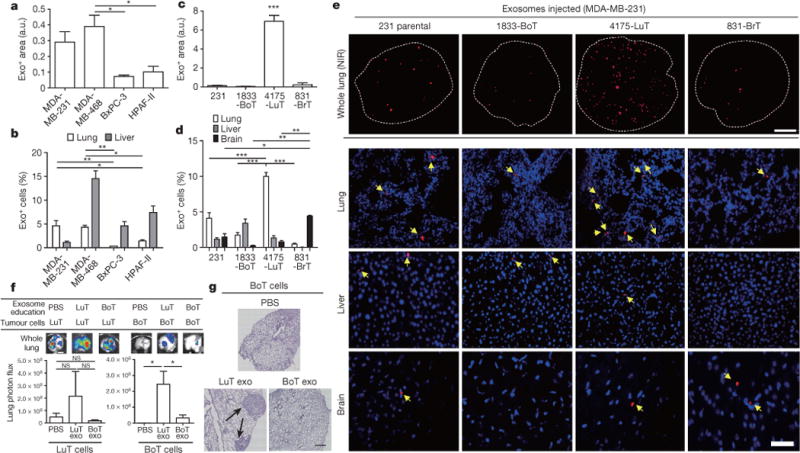
Figure 1. Cancer-cell-derived exosomes localize to and dictate future metastatic organs.

a, Biodistribution of human cancer-cell-line-derived exosomes in the lung and liver of naive mice. Quantification of exosome-positive (Exo+) areas by NIR imaging of whole lung, in arbitrary units (a.u.) (n = 3 per group). b, Immunofluorescence quantification of exosome-positive cells (n = 3, three independent experiments). c, MDA-MB-231- (parental), 1833-BoT-, 4175-LuT- and 831-BrT-derived exosome biodistribution. Quantification of exosome-positive areas by NIR imaging of whole lung (n = 3 for all, except 831-BrT, in which n = 4). d, Immunofluorescence quantification of exosome-positive cells (n = 5 animals pooled from two independent experiments). e, Top, NIR whole-lung imaging of MDA-MB-231 sublines. BoT, bone-tropic; BrT, brain-tropic; LuT, lung-tropic. Bottom, fluorescence microscopy of lung, liver and brain injected with MDA-MB-231 subline-derived exosomes. Arrows indicate exosome foci. All NIR and immunofluorescence images are representative of five random fields. f, Redirection of metastasis by education with organotropic exosomes. 4175-LuT or 1833-BoT cell metastasis in the lung after treatment with PBS, 4175-LuT or 1833-BoT exosomes. Top, quantitative bioluminescence of metastatic lesions. Bottom, graphs show quantification of luciferase activity (n = 5 for all, except for LuT exo/LuT cells, in which n = 4; data representative of two independent experiments). g, Lung haematoxylin/eosin staining for f. Arrows indicate lung metastasis. Scale bars, 5 mm (e, top, f), 50 μm (e, bottom) and 500 μm (g). Data are mean ± s.e.m. NS, not significant; * P < 0.05; ** P < 0.01; *** P < 0.001 by one-way analysis of variance (ANOVA).
