Figure 14.

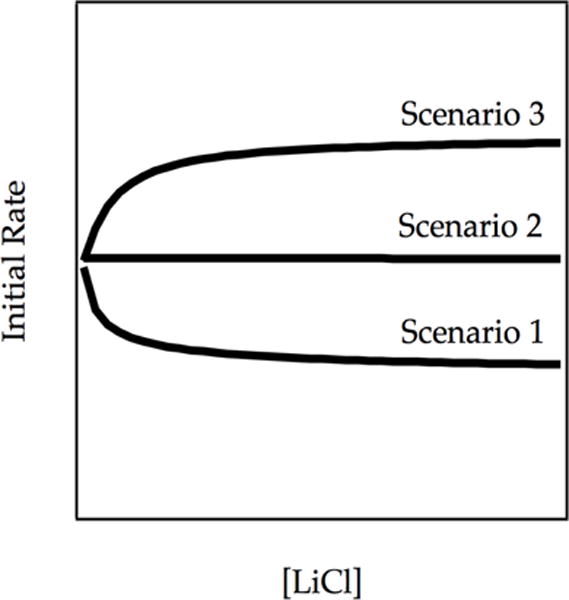
Plot of initial rate vs [LiCl] showing catalyzed inhibition (Scenario 1), no change in rate (Scenario 2), and catalyzed acceleration (Scenario 3). The curves result from numerical integrations (simulations) of the model in Scheme 7.

Plot of initial rate vs [LiCl] showing catalyzed inhibition (Scenario 1), no change in rate (Scenario 2), and catalyzed acceleration (Scenario 3). The curves result from numerical integrations (simulations) of the model in Scheme 7.