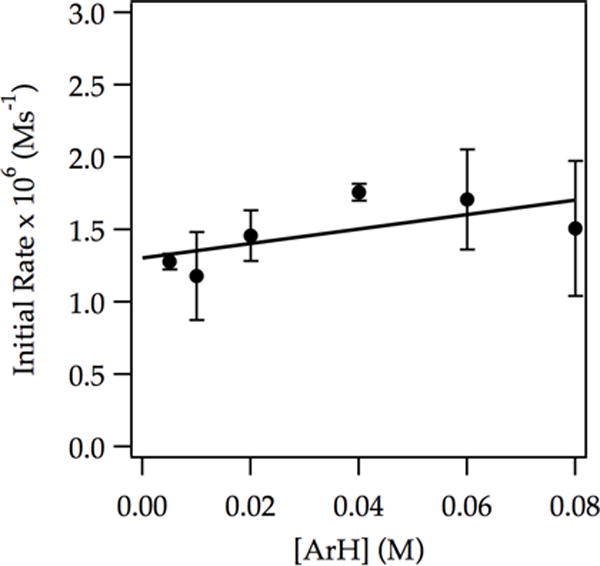
Figure 5.

Plot of initial rate vs initial ArH concentration for the ortholithiation of ArH with LDA (0.20 M) in THF (3.05 M) at −78 °C measured with IR spectroscopy (1323 cm−1). The curve depicts an unweighted least-squares fit to y = a[ArH] + b. [a = (5 ± 3) × 10−6, b = (1.3 ± 0.1) × 10−6].
