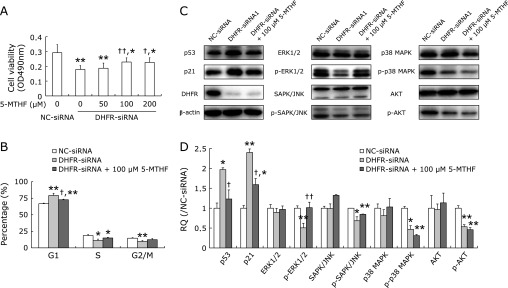
Fig. 7.
5-MTHF supplementation moderately counteracted the inhibitory effect of DHFR knockdown on EA.hy926 cells. Total of 100 nM DHFR-siRNA (mixture of DHFR-siRNA1 and -siRNA2 with 1:1) or negative control siRNA (NC-siRNA) were transfected into EA.hy926 cells, respectively. The DHFR knockdown cells were additionally treated with 5-MTHF. (A) The cell viability was measured by MTT assay at 72 h post-transfection. Experiments were performed in triplicate and data were given as mean ± SD. Representative figure from one out of three experiments is shown. (B) After DHFR knockdown by siRNA for 72 h, the cell cycle was analyzed by flow cytometry. The number of gated cells in G1, G2/M or S phase was presented as a percentage of total cells (%). Percentages of populations in each cell cycle phase were averaged from three parallel experiments. (C) The cell lysates were analyzed by western blot with specific antibodies (dilution 1:500). β-actin served as internal loading control (dilution 1:8,000). Representative gels from 3 experiments are shown. “p-” means phosphorylated protein. D) Densitometric analysis was performed for each protein band relative to β-actin in the same sample using Image Lab™ software. To compare the relative quantity (RQ) of proteins between NC-siRNA and DHFR-siRNA groups, the values of density ratio in NC-siRNA group were normalized to 1.00. *vs NC-siRNA, p<0.05; **vs NC-siRNA, p<0.01; †vs DHFR-siRNA with 0 µM 5-MTHF, p<0.05, ††vs DHFR-siRNA with 0 µM 5-MTHF, p<0.01.

