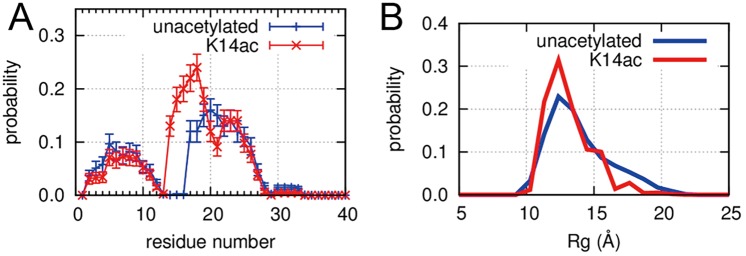
Fig 2. Impact of K14ac on H3 tail conformation.
(A) Average α-helical content ratio with the standard error for each residue of unacetylated and K14ac H3 tails. The error bars represent the standard errors calculated from 256 independent trajectories. (B) Rg distributions for unacetylated and K14ac H3 tails.

