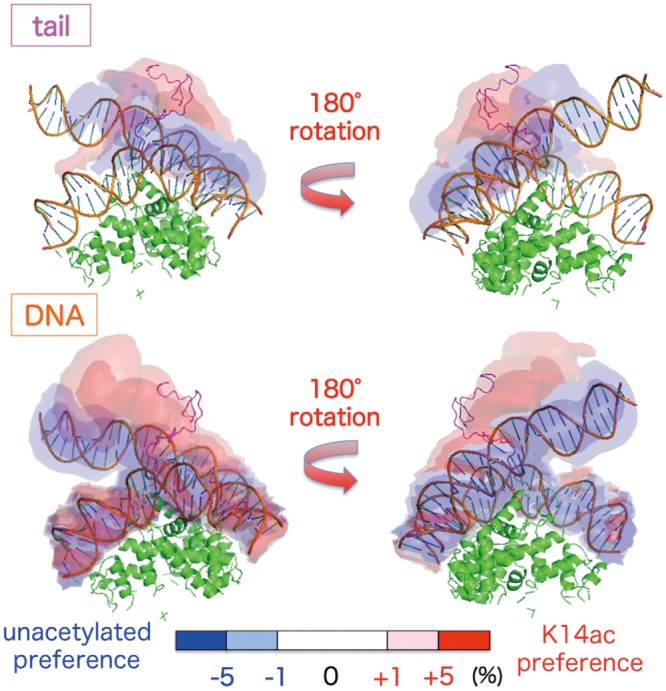
Fig 3. Differences in the spatial distributions between the unacetylated and K14ac systems.

Differences in the H3 tails and DNA are shown in the upper and lower panels, respectively. Blue and red contour maps show spatial regions preferred in the unacetylated and K14ac system, respectively. The coloring of the molecules and the nucleosome model are the same as in Fig 1.
