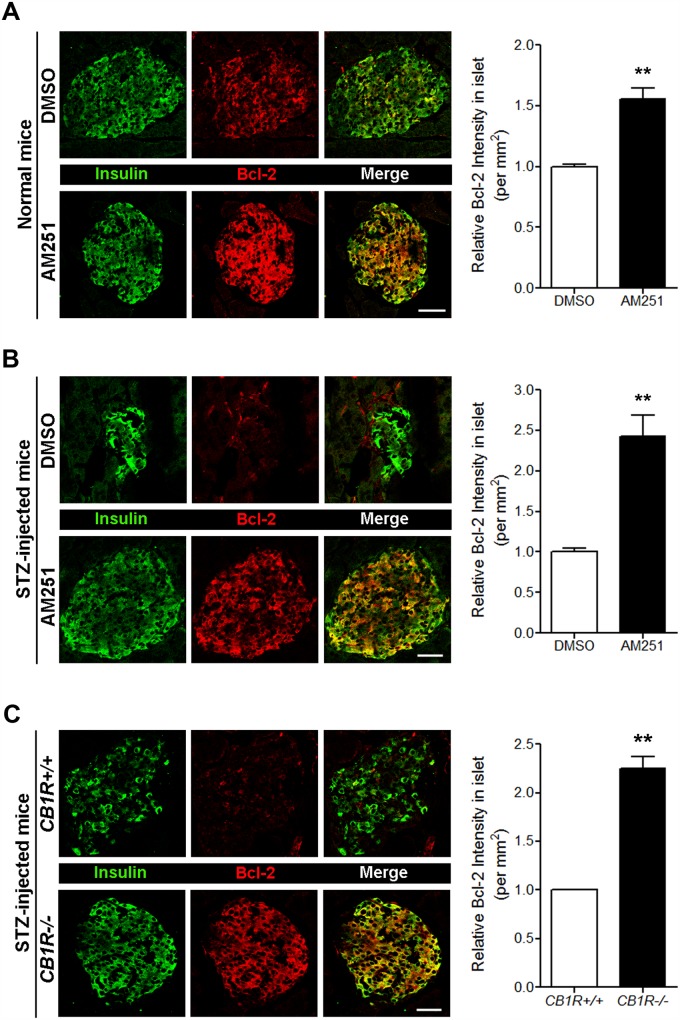
Fig 3. Blockade of CB1Rs in normal and STZ-treated mice increases Bcl-2 levels in β cells.
(A) Representative images for insulin and Bcl-2 in β cells of DMSO- and AM251-injected normal mice. The relative signal intensity for Bcl-2 in β cells is shown on the right. (B) Representative images for insulin and Bcl-2 in β cells of DMSO- and AM251-injected mice after STZ treatment. The relative signal intensity for Bcl-2 in β cells is shown on the right. (C) Representative images for insulin and Bcl-2 in β cells of CB1R+/+ and CB1R-/- mice 4 weeks after STZ treatment. The relative signal intensity for Bcl-2 in β cells is shown on the right. Data are shown as the mean ± SEM from n = 3–5 animals per group. *P< 0.05; **P< 0.01. Scale bar, 50 μm.

