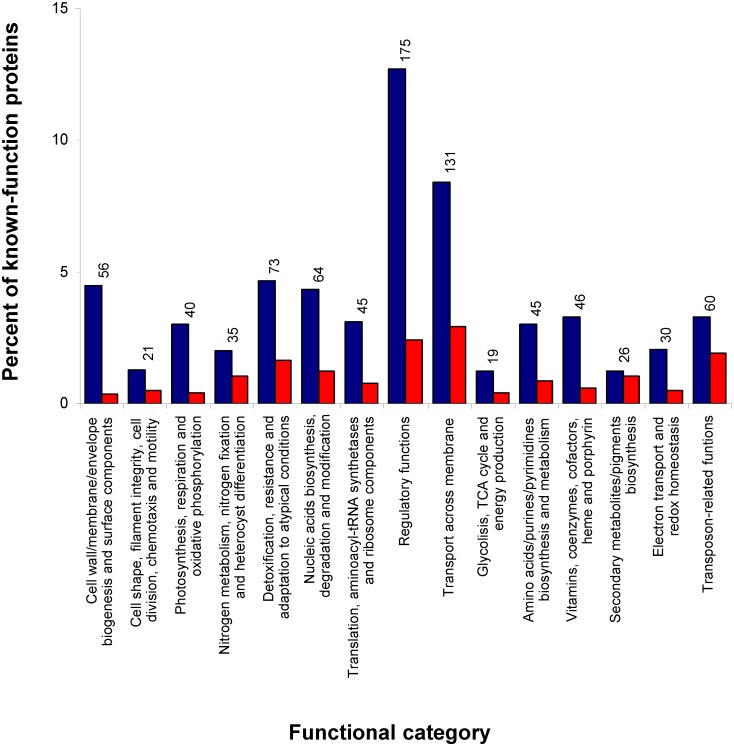
Fig 3. Distribution of known-function genes which exhibited differential expression after turning off furA in the coaR-PcoaT::furA fusion strain AGcoaRFurA.
Blue columns represent the percent of genes down-regulated of the total (n = 1155) genes with defined function, distributed according to their functional category. Red columns represent the percent of genes up-regulated. The numbers over the columns indicate the total amount of genes by functional category showing differential expression.

