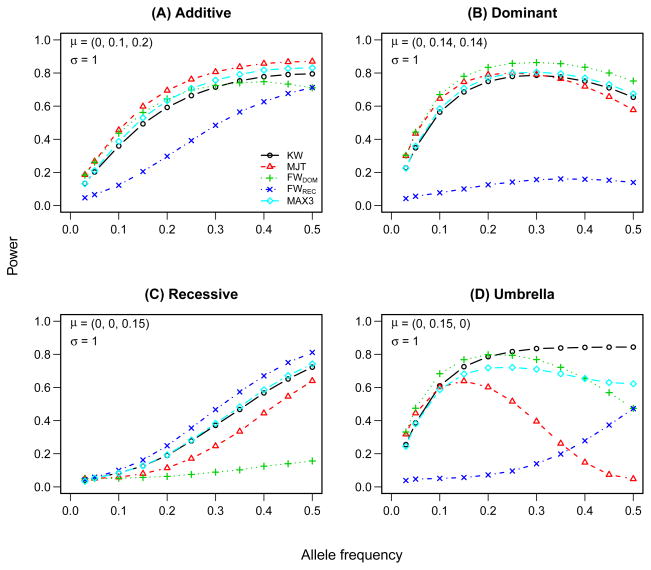
Figure 3.
Power of rank-based association tests under normal error distribution and different genetic models. The parameters of data generating model are shown in the upper left corner. KW - Kruskal-Wallis test; MJT - modified Jonckheere-Terpstra test; FW - Fligner-Wolfe test for the dominant (DOM) and recessive (REC) models; MAX3 - rank-based maximum test.

