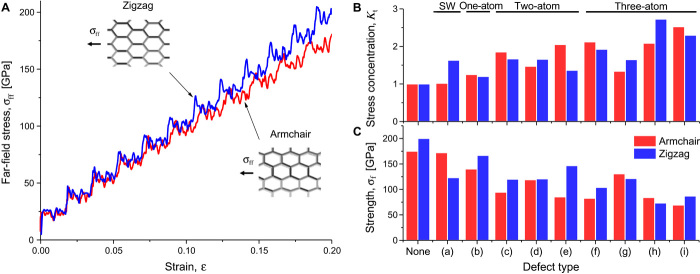
Fig. 2. Simulated stress and strength of SWNTs under tension.
(A) Stress-strain curves of defect-free zigzag and armchair SWNTs. The images show the SWNTs’ deformation at 20% strain. (B) Maximum stress concentration Kt in armchair and zigzag SWNTs containing defects of various shapes and sizes (Fig. 1, B and C), at a strain of ~10%. The number of missing atoms in vacancies is indicated at the top of the figure. (C) Ultimate tensile strength σf in armchair and zigzag SWNTs containing defects of various shapes and sizes. Kt and σf data are provided in note S4.

