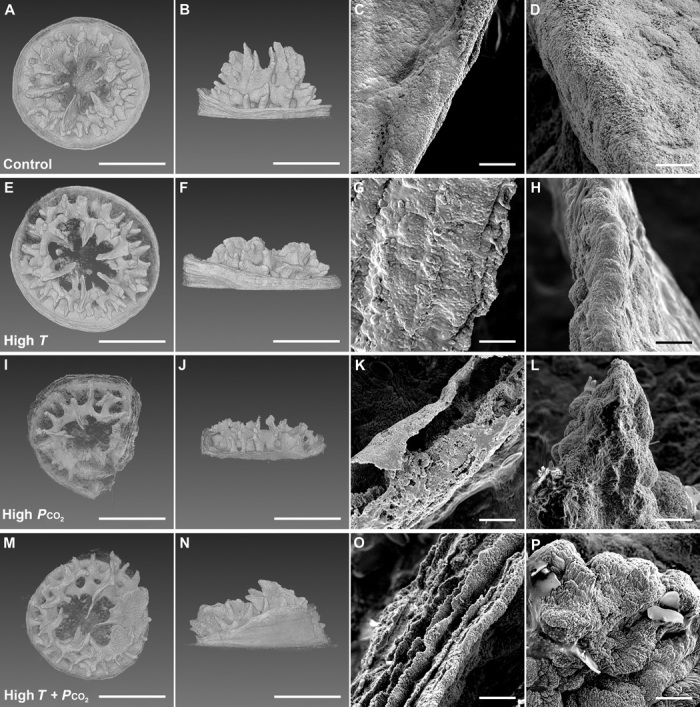
Fig. 1. X-ray microscopy and SEM images of 1-month-old coral skeletons under the four temperature-Pco2 treatments (A to P).

Treatments include control (A to D), high T (E to H), high Pco2 (I to L), and high T + Pco2 (M to P). 3D x-ray images: top-down view (A, E, I, and M) and side view (B, F, J, and N). Scale bars, 500 μm. SEM images: top of the corallite wall (C, G, K, and O) and a tertiary septum (D, H, L, and P). Scale bars, 10 μm. The four images shown in each row are of a single, representative individual from each treatment. See figs. S5 to S8 for images of the other individuals from each treatment.
