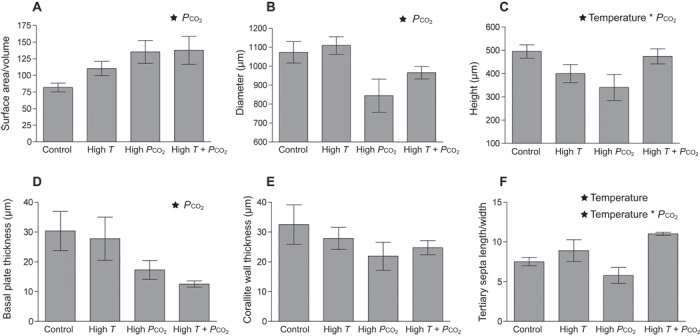
Fig. 3. Quantitative output from x-ray microscopy scans of 1-month-old coral skeletons under the four temperature-Pco2 treatments (mean ± SE).

(A to F) Measurements include (A) SA/vol ratio, (B) diameter, (C) height, (D) basal plate thickness, (E) corallite wall thickness, and (F) tertiary septa length/width ratio. Factors [temperature, Pco2, or their interaction (temperature *Pco2)] significantly contributing to differences between treatments are indicated by ★ at the top of the graph (n = 5 individuals per treatment). See table S2 for details on statistical tests.
