
Fig. 3. The impact and identity of the drivers of annual rates of colonization and extinction have changed.
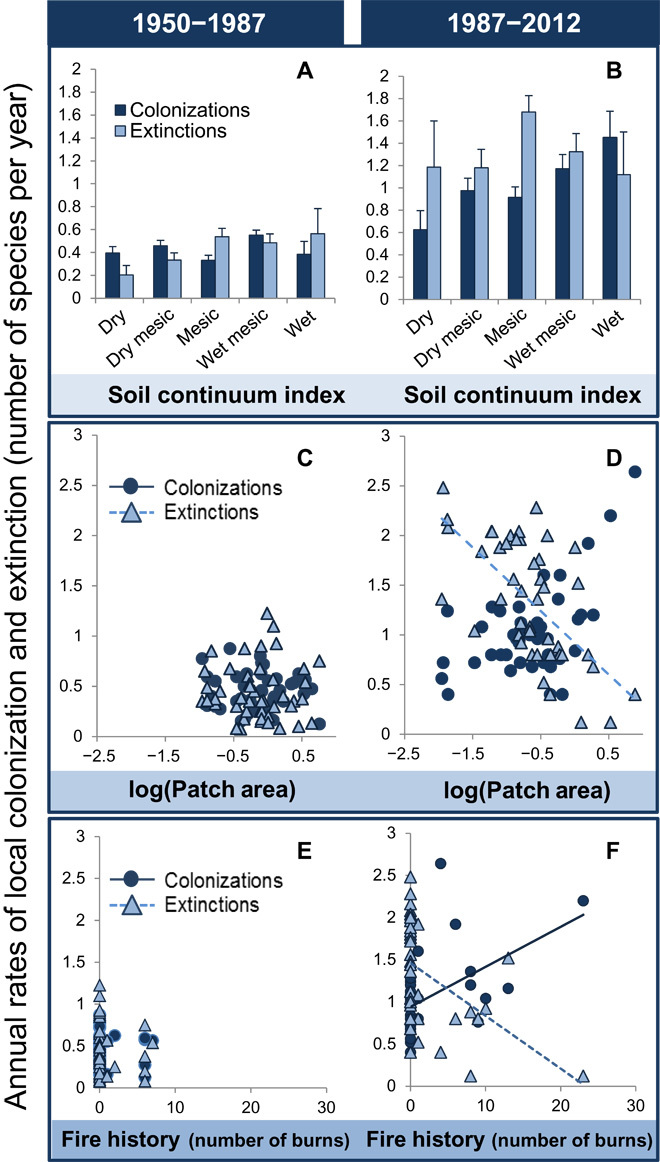
Between 1950 and 1987, colonization and extinction rates were significantly related to the soil continuum index, but not patch area (C) or fire history (F). Between 1987 and 2012, the soil continuum index (B), fire history (D), and patch area (F) were significant drivers of colonization and extinction. Trend lines in (C) to (F) represent statistically significant relationships. For statistical relationships, see table S1.