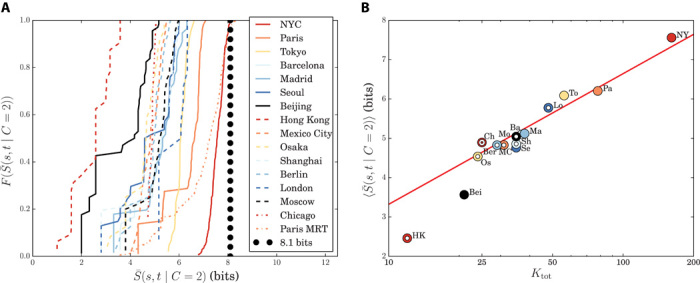
Fig. 2. Information threshold.

(A) Cumulative distribution of the information needed to encode trips with two connections in the 15 largest metropolitan networks. The largest value occurs for the NYC metropolitan system (red solid curve), which has trips with a maximum of Smax ≈ 8.1 bits. Among the 15 networks, the Hong Kong (red dashed curve) and Beijing (black solid curve) metropolitan networks have the smallest number of total connections and need the smallest amount of information for navigation. The Paris MRT (Metropolitan, Light Rail, and Tramway) network (orange dashed-dotted curve) from the official metro map (33) includes three transportation modes (which are managed by two different companies) and reaches values that are similar to those for the (larger) NYC metropolitan system. (B) Information threshold versus total number of connections in the dual space. This plot illustrates that the average amount of information needed to encode trips with two connections is strongly correlated with the total number of connections in the dual network, as can be predicted for a square lattice (see Materials and Methods). See table S1 for the definitions of the abbreviations. The color code is the same as in (A), and the red solid line represents the square-lattice result . This relationship permits one to associate the information threshold Smax with the cognitive threshold , which one can interpret as the maximum number T of intraroute connections that can be represented on a map.
