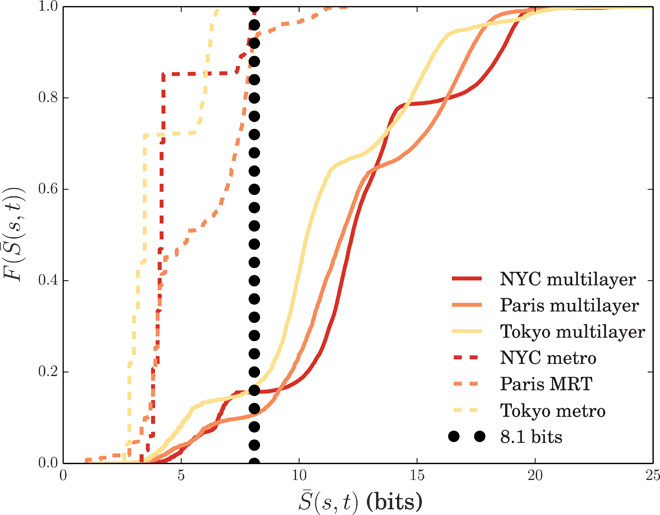
Fig. 4. Information entropy of multilayer networks.

The solid curves represent the cumulative distributions of for multilayer networks that include a metro layer for NYC, Paris, and Tokyo. (We associate one layer with bus routes and another layer with metro lines.) Most of the trips require more information than the cognitive limit Smax ≈ 8.1. The fractions of trips under this threshold are as follows: 15.6% for NYC, 10.7% for Paris, and 16.6% for Tokyo. The dashed curves are associated with all possible paths in a metro layer. In this case, the amount of information is always under the threshold, except for Paris, which includes trips with C = 3 (see table S3). Note that the threshold value lies in a relatively stable part of all three cumulative distributions, suggesting that our results are robust with respect to small variations of the threshold.
