
Fig. 3.
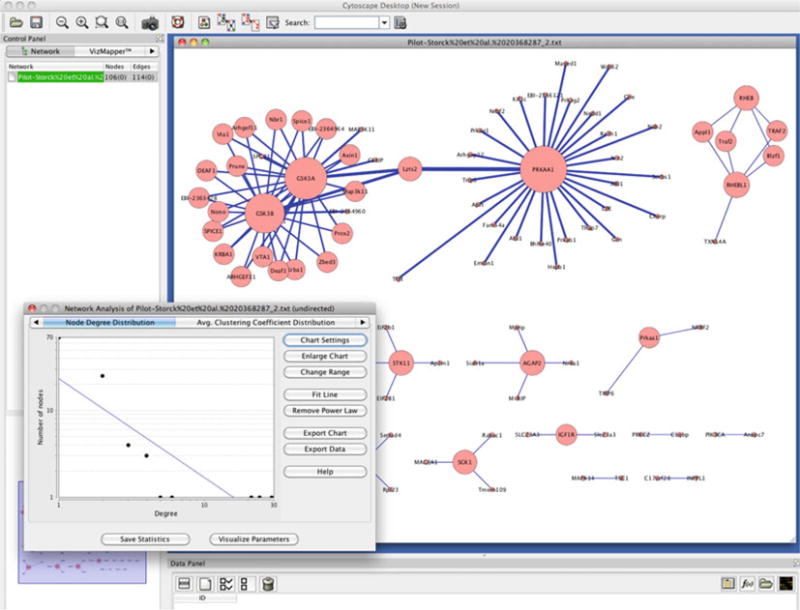
Cytoscape (18) and network analysis plug-in is shown. The plot on the left bottom shows that the degree distribution of the analyzed network likely follows a power law. The nodes in the networks are sized by their node degree.
Official websites use .gov
A
.gov website belongs to an official
government organization in the United States.
Secure .gov websites use HTTPS
A lock (
) or https:// means you've safely
connected to the .gov website. Share sensitive
information only on official, secure websites.
Cytoscape (18) and network analysis plug-in is shown. The plot on the left bottom shows that the degree distribution of the analyzed network likely follows a power law. The nodes in the networks are sized by their node degree.