Fig. 4.

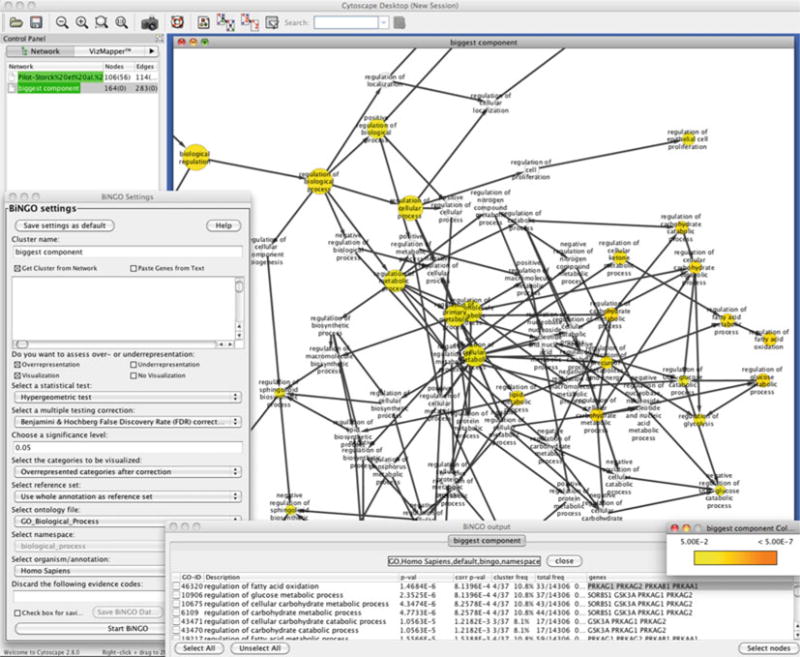
Enrichment analysis of the biggest component of the network analyzed (Fig. 3) is shown. A section of the gene ontology term graph is shown in the background. The Bingo plug-in settings and the output are shown in the foreground.

Enrichment analysis of the biggest component of the network analyzed (Fig. 3) is shown. A section of the gene ontology term graph is shown in the background. The Bingo plug-in settings and the output are shown in the foreground.