
Supplemental Fig. 1.
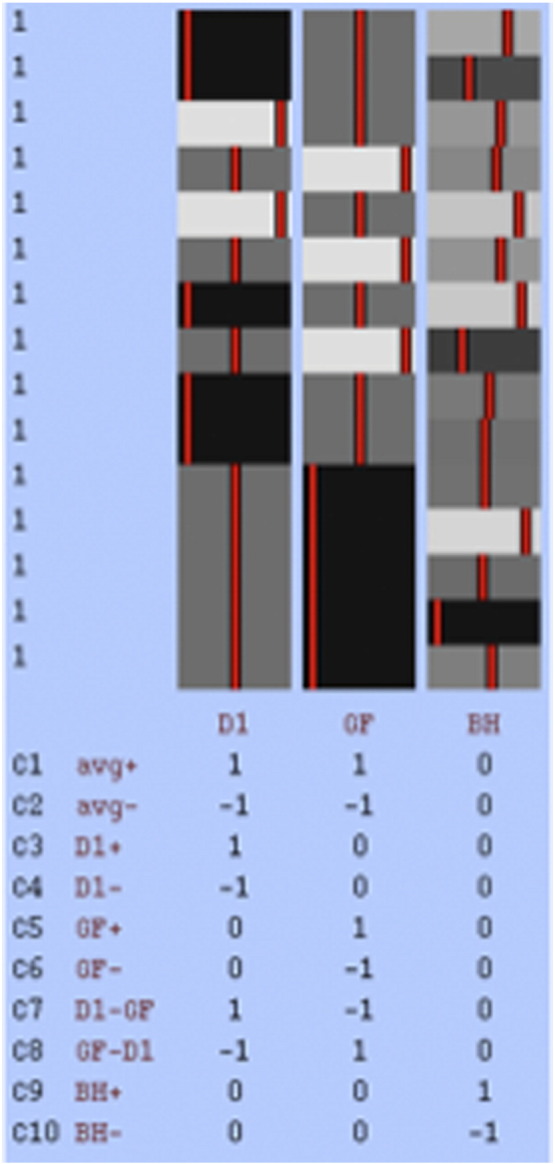
Design matrix for the group analysis showing the dopamine odor conditioning interaction (D1), control drug conditioning interaction (GF), and the orthogonalized place preference score (BH). Each row corresponds to a subject. The gray scale to the right represents the regressor values. The +1 or −1 represents white or black color the subject was cocaine-conditioned to almond or rose. The table below shows the statistical contrasts defined as a function of these regressors. This is standard output from the FSL fMRI analysis program.