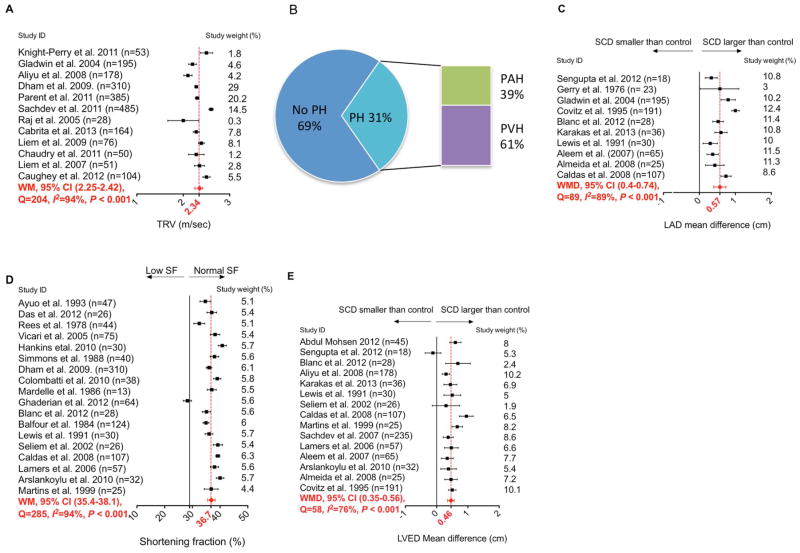
Figure 3. Meta-analysis Summarizing the TRV, PH, LAD, SF and LVED in SCD Patients.
(A) Mean TRV values for SCD patients in different studies with weighted mean TRV and 95-percent confidence interval for the included studies. (B) The percentage of SCD patients with RHC-confirmed PH, PAH and PVH in patients that had TRV≥2.5 m/sec. Data are pooled from four different studies. (C) The mean difference between LAD in SCD and control groups in different studies, and the weighted mean difference with 95-percent confidence interval. (D) The mean SF for SCD population in different studies with weighted mean SF and 95-percent confidence interval. (E) The mean difference between LVED in SCD group and control group in different studies and the weighted mean difference with 95-percent confidence interval. Weighted mean and weighted mean difference values in plots A, C, D and E were calculated using a random-effects model. Each point represents mean value spanned by its 95-percent confidence interval.

