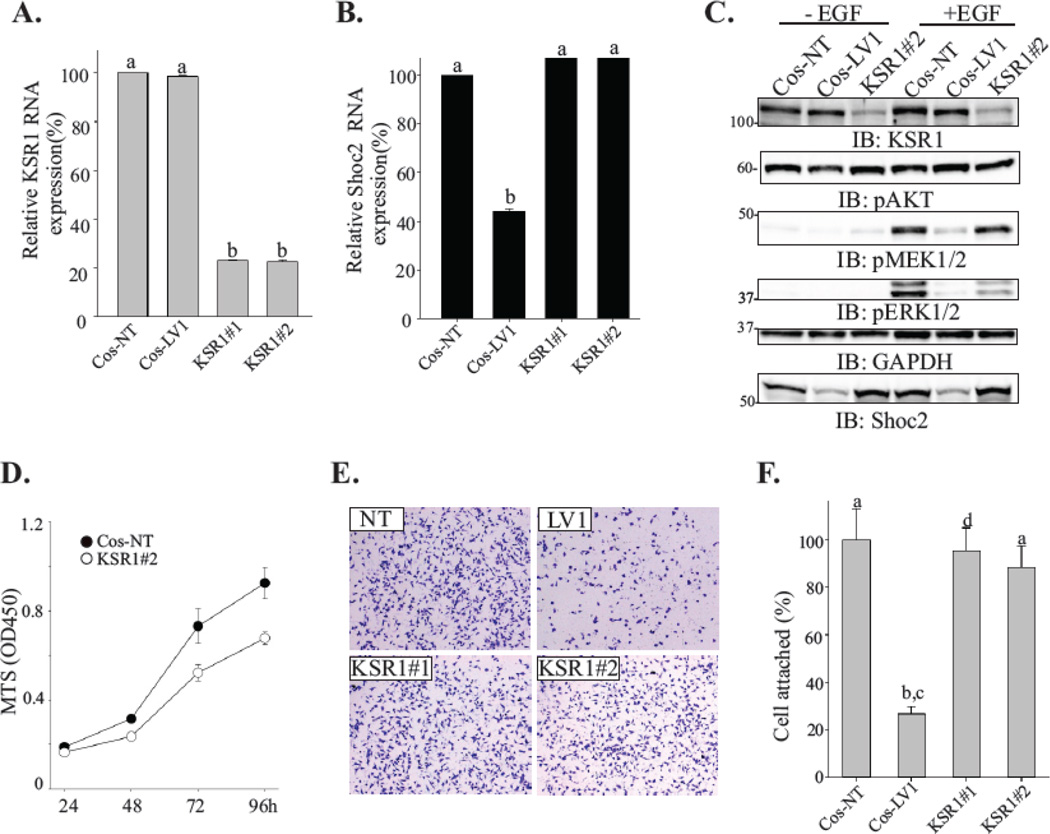
Figure 2. Depletion of KSR1 does not affect cell attachment.
(A, B) Total RNA was extracted from cells depleted of Shoc2 (LV1) or KSR1 (KSR#1 and KSR#2) and quantitative RT-PCR was performed using Shoc2 and KSR1-specific primers. Data are presented as the fold change of KSR1 (A) or Shoc2 (B) mRNA levels normalized to control (NT) (mean ± SD, n = 2; a vs. b, p<0.05).
(C) Cells were serum-starved for 18h and stimulated with 0.2 ng/mL EGF for 7 min. Expression of the indicated proteins was analyzed using specific antibodies. Representative blots are shown from multiple experiments.
(D) Equal numbers of cells constitutively expressing either KSR1 shRNA (open circle) or nontargeting shRNA (solid circle) were plated into a 96-well plate. The viability of cells was measured using a CellTiter 96 AQueous One solution cell proliferation assay. The mean number ± SD from triplicate experiments is shown.
(E) Cells were seeded on a collagen pre-coated 96-well plate for 10 min. Images of cells fixed and stained with crystal violet were obtained using a Nikon Eclipse E600 microscope.
(F) Cells from the experiments in E were solubilized with 2% SDS and subjected to the colorimetric absorbance measurement (OD550). Data from three independent experiments was analyzed and bars represent the mean values ± SD, n = 3; a vs. b, P < 0.05.

