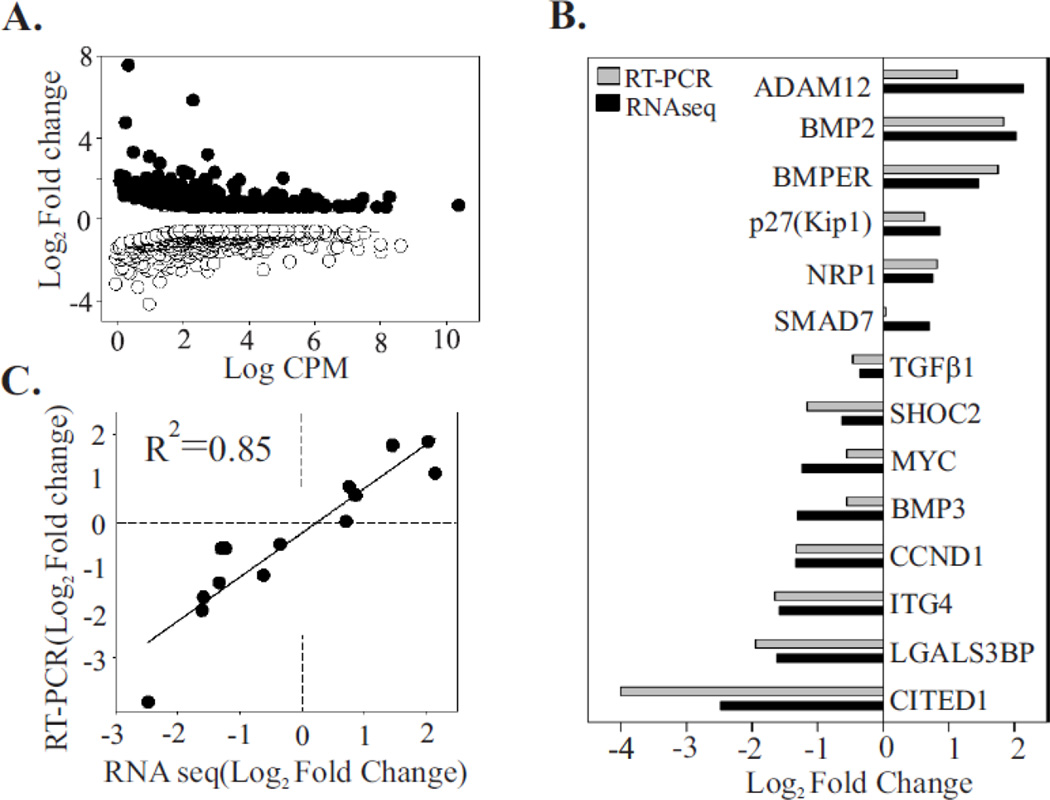
Figure 3. Validation of the RNA-seq approach using RT-PCR.
(A) Differential gene expression between control sample (NT) and samples depleted of Shoc2 (LV1). The differential expression (log2fold change for LV1 samples compared to NT) is plotted against the log count per million for each gene. Each point represents a single ID of the reference transcriptome. Of 853 differentially expressed genes, 317 were upregulated (solid circle) and 536 were downregulated (open circle) (Fold change > 1.5, FDR <0.05).
(B) Fourteen differentially expressed genes were arbitrary selected from a range of upregulated and downregulated genes. Levels of expression were quantified by RT-PCR and the results were compared to those obtained by the RNA-seq approach. The log2fold change in gene expression of RT-PCR and RNA-seq approach were closely correlated (R2 = 0.85), indicating the accuracy of the RNA-seq analysis (C).

