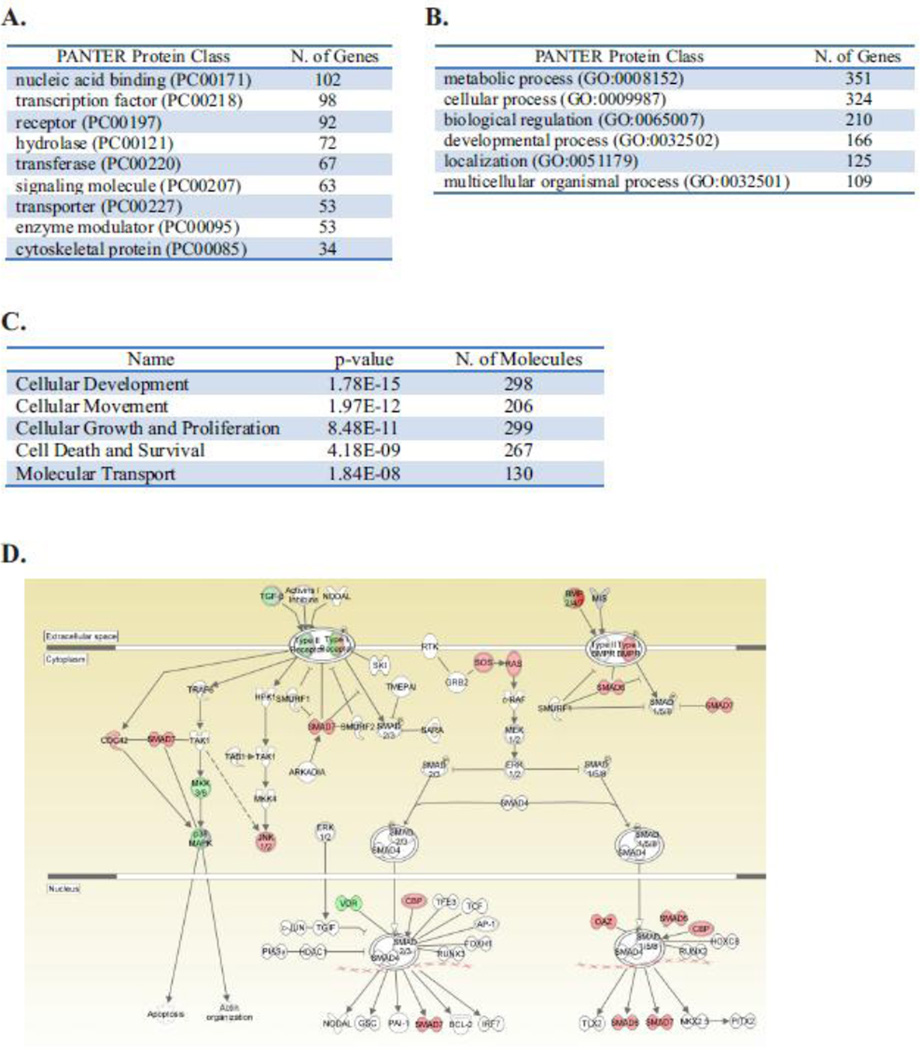
Figure 4. Biological processes associated with loss of Shoc2 in cells.
The top protein classes (A) and biological processes (B) of 853 differentially expressed genes (fold change >1.5, FDR <0.05) analyzed with PANTHER pathway analysis.
(C) Differentially expressed genes were analyzed by Ingenuity Pathway Analysis. The molecular and cellular functions identified by the analysis are presented.
(D) In-depth Ingenuity Pathway Analysis of differentially expressed genes revealed changes in regulators of the BMP/TGFβ pathway (red, upregulated expression; green, downregulated; gray, no-changed; white, not listed in A–C).

