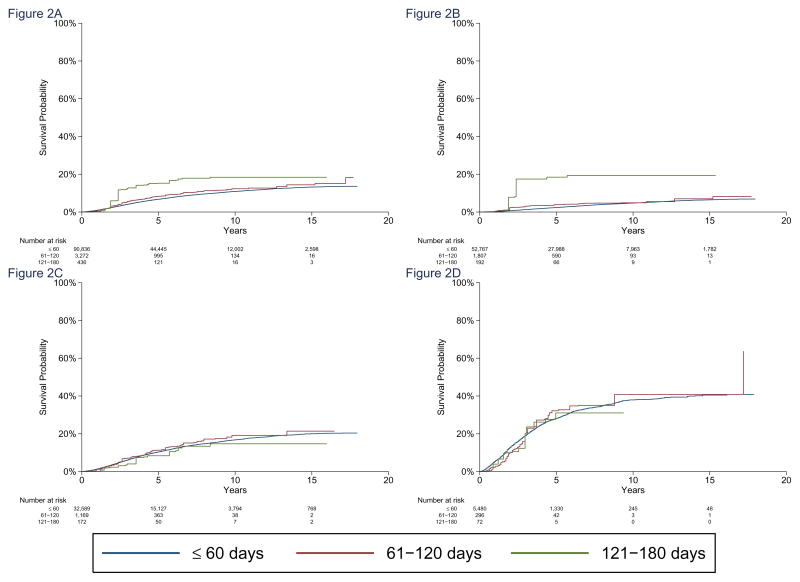
Figure 2. Adjusted Breast Cancer-Specific Mortality.
Adjusted breast cancer-specific mortality for SEER-Medicare patients, for preoperative delay intervals of ≤60, 61–120, and 121–180 days. Panels show (A) all stages combined, (B) Stage I, (C) Stage II, and (D) Stage III patients. SubHazard ratio for all stages was 1.26 (95% CI: 1.02–1.54, p=0.03), and subHazard ratios were 1.84 for Stage I (95% CI: 1.10–3.07, p=0.020), 1.03 (95% CI: 0.83–1.28, p=0.80) for Stage II, and 1.04 (95%CI: 0.82–1.33, p=0.74) for Stage III. p-values for comparing the sHR in Stage I to the sHRs in Stage II and III were p=0.042 and p=0.059, respectively.
A. All stages combined.
B. Stage I patients.
C. Stage II patients.
D. Stage III patients.

