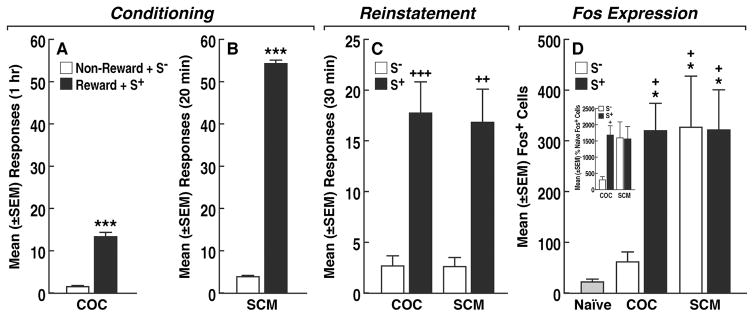
Fig. 2.
(A, B) Differences in responding between S+ and S− sessions at the end of the conditioning phase for COC and SCM, respectively. ***p < 0.001, vs. respective S−. (C) Following conditioning and after extinction, presentation of the COC S+ or SCM S+ (but not the non-reward S−) produced robust reinstatement. +++p < 0.001, ++p < 0.01, vs. respective S−. (D) Fos+ cells in the PVT following SD presentation. +p < 0.05, vs. COC S−; *p < 0.05, vs. naive. (Inset) Percentage of naive Fos+ cells. +p < 0.05, vs. COC S−.

