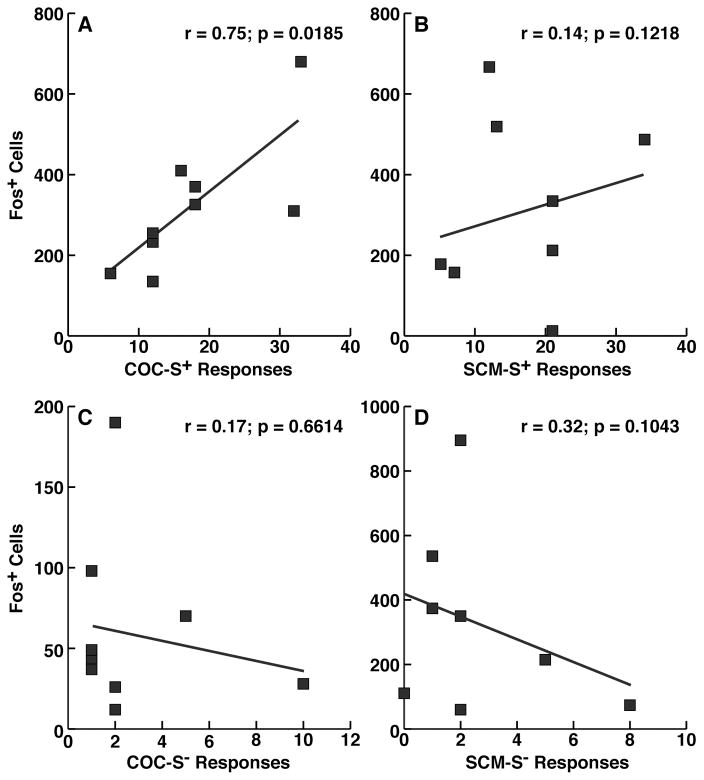
Fig. 3.
Correlation between S+- and S−-induced behavior and Fos expression in the PVT. The figure shows correlation plots between the number of reinstatement responses and number of Fos+ cells, confirming behaviorally correlated recruitment of the PVT during S+-induced reinstatement of cocaine seeking (A) but not SCM seeking (B). No correlations were found between Fos-expressing neurons and COC S− or SCM S− responses (C, D).

