Figure 1.
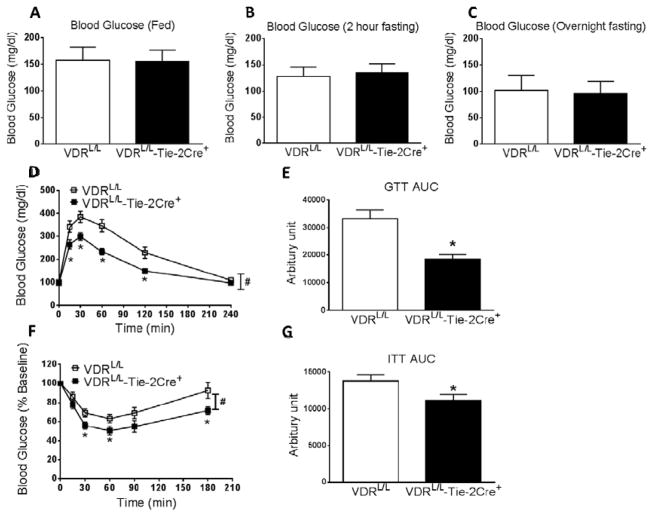
VDRL/L-Tie-2Cre+ mice have normal blood glucose levels, but increased glucose disposal and insulin sensitivity, at 24 weeks of age. A. Blood glucose in fed mice (n=7). B. Blood glucose after 2 hours of fasting (n=8). C. Blood glucose after overnight fasting (n=19). D. Glucose tolerance test (n=19). *p<0.05 vs. VDRL/L at indicated time point. # p=0.002 vs. VDRL/L assessed by two-way ANOVA for repeated measurements. E. The area under the curve (AUC) for glucose levels during glucose tolerance tests (n=19). *p<0.05 vs. VDRL/L. F. Insulin tolerance test (n=14–18). *p<0.05 vs. VDRL/L at indicated time point. # p=0.029 vs. VDRL/L assessed by two-way ANOVA for repeated measurements. G. The AUC of glucose levels during insulin tolerance tests (n=14–18). *p<0.05 vs. VDRL/L.

