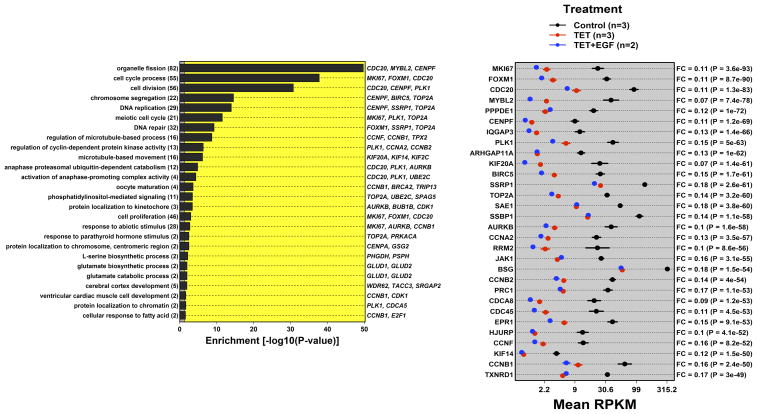
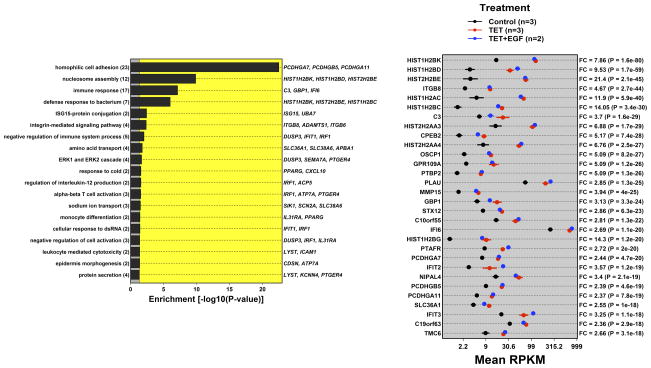
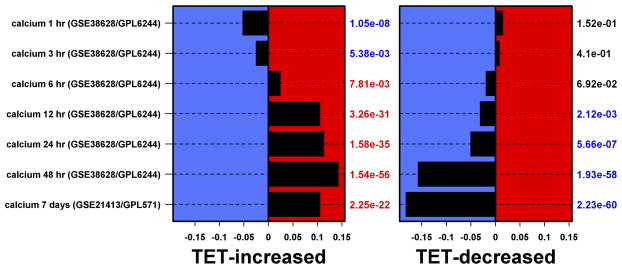
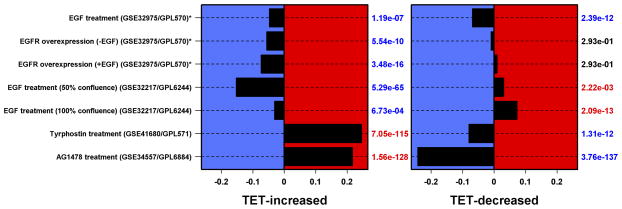
Figure 2. AREG silencing reduces expression of genes regulating G2/M and/or cytokinesis.
N/TERT-TR-shAREG cells were incubated in the presence or absence of Tet with and without 20 ng/ml EGF for 60 h, followed by analysis of global gene expression by RNA-seq. (A and B) Gene ontology analysis of genes downregulated by Tet and not normalized by EGF (A) or upregulated by Tet and not repressed by EGF (B). Left panels: bars indicate P -values for the most significant GO terms with the categories on the left, (followed by the number of genes for each category in parentheses), and the most significantly altered transcripts shown on the right. Right panels: Gene names are indicated on the left and fold-change (FC) for Tet versus control and P -values are shown on the right. Black = control, blue = Tet, red = Tet + EGF. Numbers underneath the panel are mean RPKM (reads per kilobase per million mapped reads). Only the 30 most significant genes are shown. (C) Overlap between DEGs whose expression was increased or decreased by Tet and genes whose expression is altered by Ca2+-mediated keratinocyte differentiation (red = increased by calcium, blue = decreased). (D) Overlap between DEGs whose expression was increased or decreased by Tet and genes whose expression is altered by EGF treatment, EGFR overexpression or EGFR inhibitor (Tyrphostin or AG1478) treatment (red = increased by treatment or EGFR overexpression, blue = decreased).


