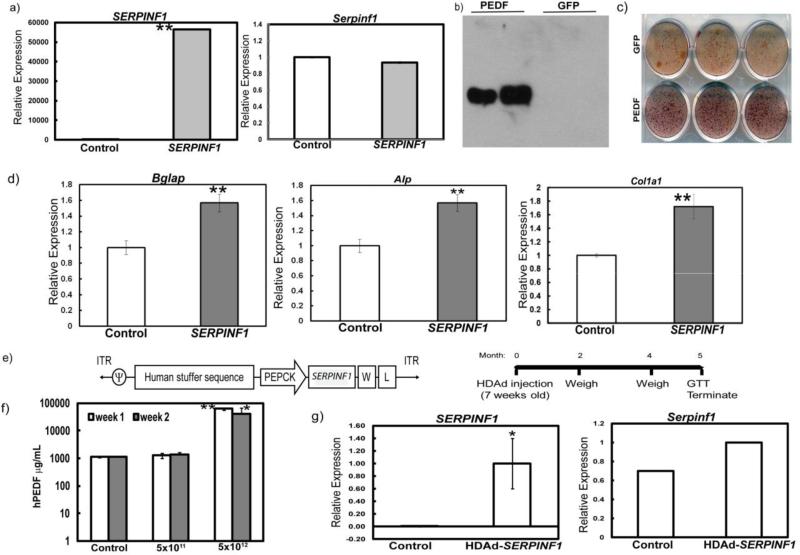
Figure 1. Overexpression of SERPINF1 in MC3T3 cells and mouse liver.
a) Real-time PCR analysis for SERPINF1 and Serpinf1 in cells overexpressing SERPINF1 (hPEDF) and a vector containing GFP showing relative expression to control (**p<0.005); b) Western blotting using anti-PEDF antibody of media from cells overexpressing SERPINF1 (hPEDF) and a vector containing GFP; c) Alizarin Red staining of MC3T3 cells transduced with SERPINF1 vs. GFP control vector; d) Real-time PCR analysis for Bglap, Alp and Col1a1 (**p<0.005; unpaired t-test) relative expression to GFP control infected cells; e) Schematics of the HDAd-mediated SERPINF1 expression construct (left panel) and experimental time course (right panel); f) Serum ELISA of mice injected with PBS (Control), 5×10¹¹ and 5×10¹² viral particles per kilogram (VP/kg) one and two weeks after injection; N=5 per group (*p< 0.05; **p<0.005; unpaired t-test compared to the PBS injected controls); g) Real-time PCR for human SERPINF1 and mouse Serpinf1 in the livers of mice injected with PBS (Control, N=4) or human PEDF virus, N=3 (*p<0.05; unpaired t-test) showing relative expression compared to control.

