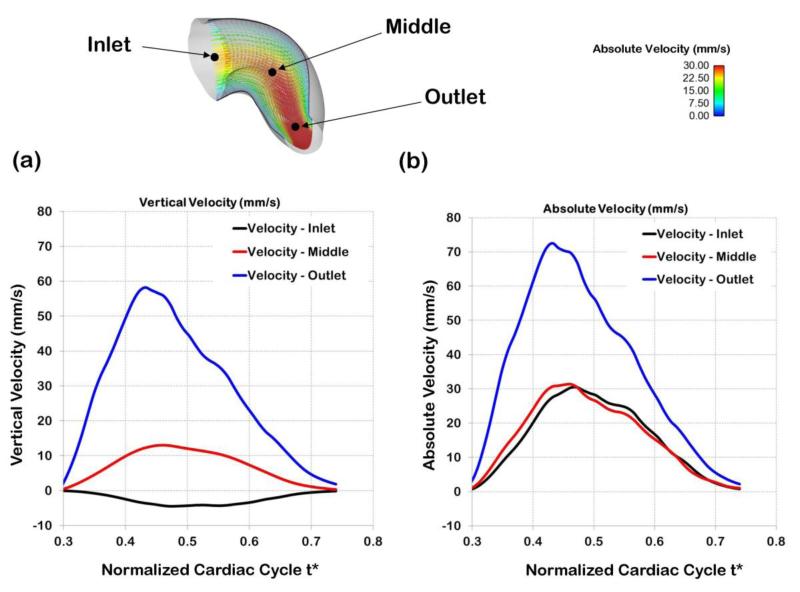
Figure 10.
Comparison of centerline velocities at different points along the OFT. The points chosen for comparison (inlet, middle, outlet) are shown on top. The middle point corresponds to the point q selected and used in the optimization procedure. (a) Vertical velocities at the three locations over the portion of the normalized cardiac cycle considered for computations (t* = 0.3 to t* = 0.74). Vertical velocities at the inlet are negative, as opposed to the middle and outlet velocities, due to the OFT geometry and the sign convention used in this work. (b) Absolute velocities (velocity magnitudes) at three locations along the OFT over the modeled portion of the cardiac cycle.

