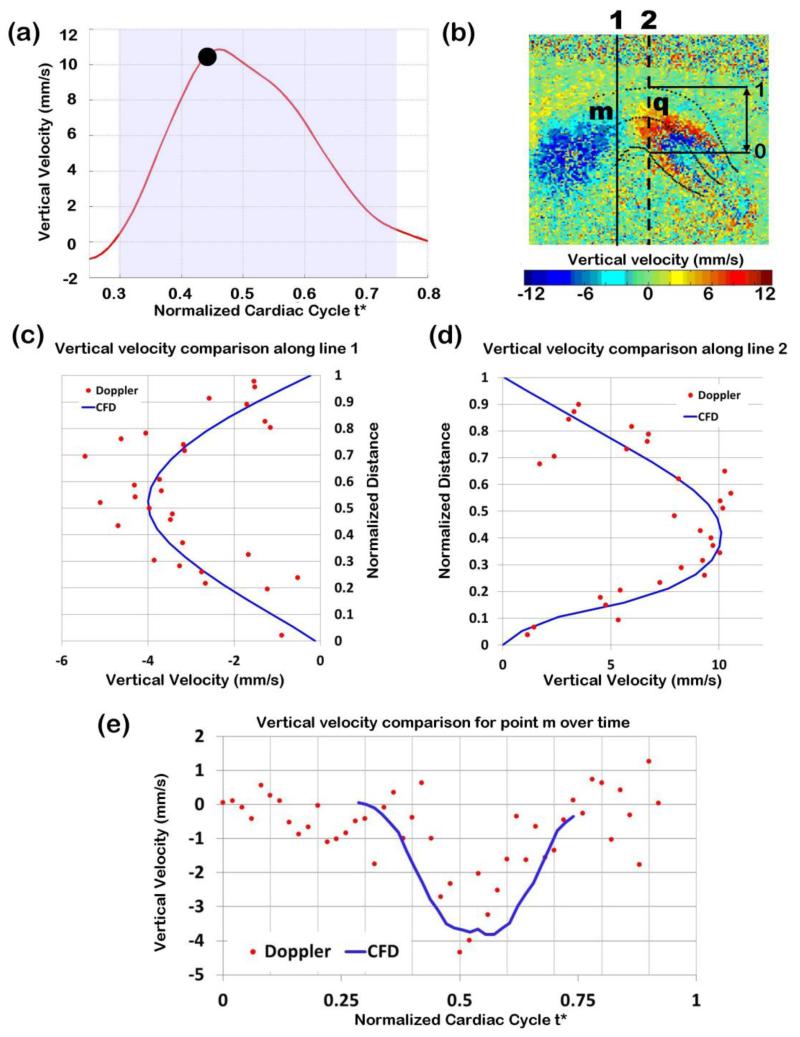
Figure 7.
Comparison of Doppler velocity and CFD computed velocities. (a) Vertical velocity measured at point q over time, with the time analyzed (t*=0.47) marked. (b) Doppler velocity image of the expanded OFT configuration, depicting the lines along which Doppler velocities were compared with CFD computed velocities. (c) and (d) Comparison of raw Doppler velocity data (red dots) versus CFD computed velocity (blue solid line): (c) along a line close to the OFT inlet (black solid line in b); and (d) along a line passing through the selected point q (black dotted line in b). Note that the vertical velocities depicted change signs due to the OFT curvature: velocity is upward close the OFT inlet (showing as negative velocities in c) and downwards towards the OFT outlet (showing as positive velocities in d). Distances in (c) and (d) were normalized to the OFT lumen width (distance between the lower lumen boundary and the upper lumen boundary) at the corresponding position. (e) Comparison of Doppler and CFD velocities at point m (shown in (b)) over time from t*=0.3 to t*=0.74.

