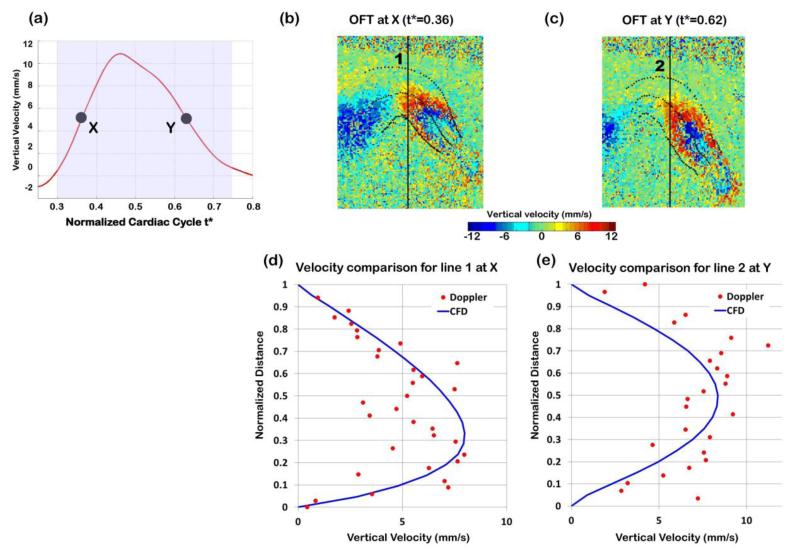
Figure 8.
Comparison of Doppler velocity and CFD computed velocities when the OFT was opening (t* = 0.36) and closing (t* = 0.62). (a) Vertical velocity measured at point q over time, with times analyzed marked. (b) and (c) Doppler velocity data from OCT depicted on longitudinal sections of the OFT during opening (t* = 0.36) and closing (t* = 0.62), respectively. (d) and (e) Comparison of Doppler velocity data (red dots) versus CFD computed velocity (blue solid line) along a line passing through the selected point q when (d) the OFT is opening and (e) the OFT is closing.

