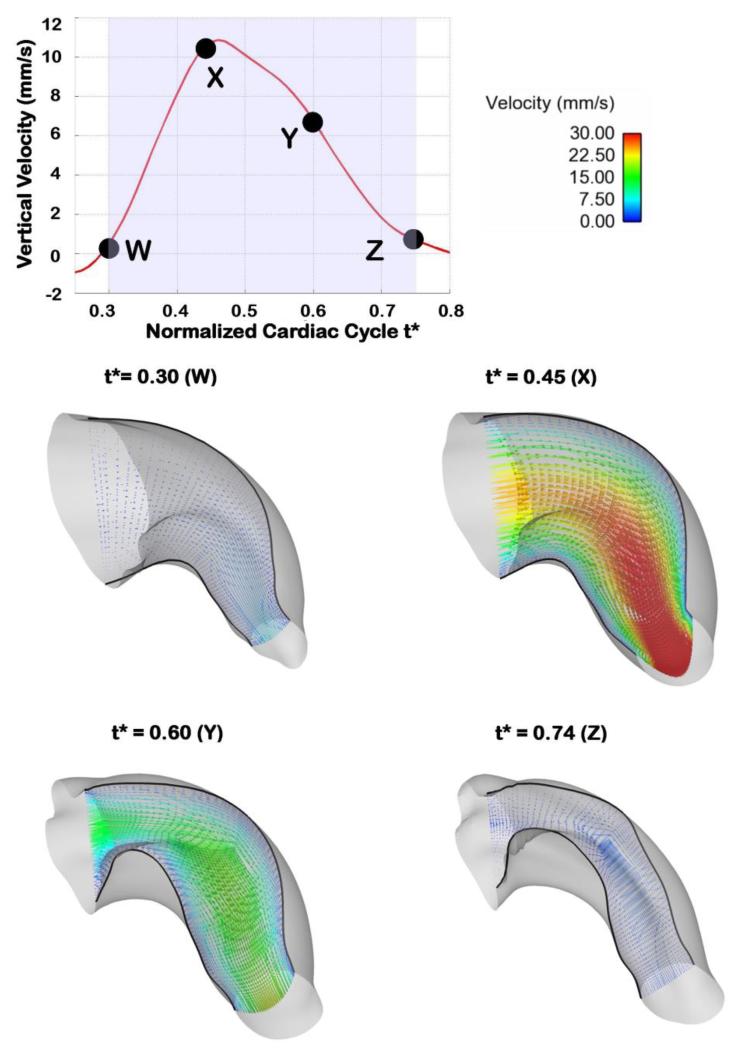
Figure 9.
OFT velocity vectors over the cardiac cycle. The top plot shows the vertical velocity at the selected point q, and depicts the times in the cardiac cycle at which 3D plots of blood flow velocity are shown. The four bottom graphs show velocity vectors along a slice through a longitudinal section of the OFT, at distinct normalized times over the portion of the cardiac cycle simulated. The length and coloring of the velocity vectors are based on the velocity magnitude and the boundaries of the longitudinal slice are shown with black solid lines.

