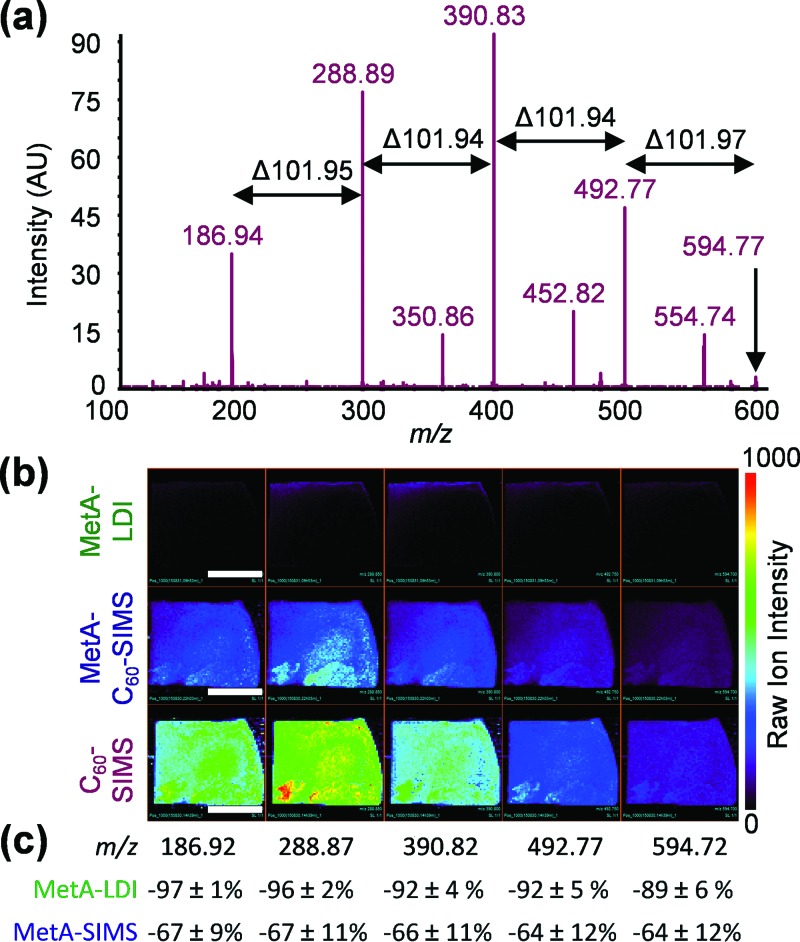
Fig. 2.
(a) In situ C60-SIMS MS2 of a representative media-specific ion, m/z 594.8, produces the successive loss of 101.95 to generate several high-abundance ions that are also found in the MS1 spectra; (b) MS1 images of the m/z 186.92–594.72 ion sequence in biofilm 2; and (c) relative abundance change between C60-SIMS and the other two ionization modalities. The white scale bars in (b) represent 1 cm, and the error in (c) was calculated as the relative standard deviation between biofilms with n = 3.

