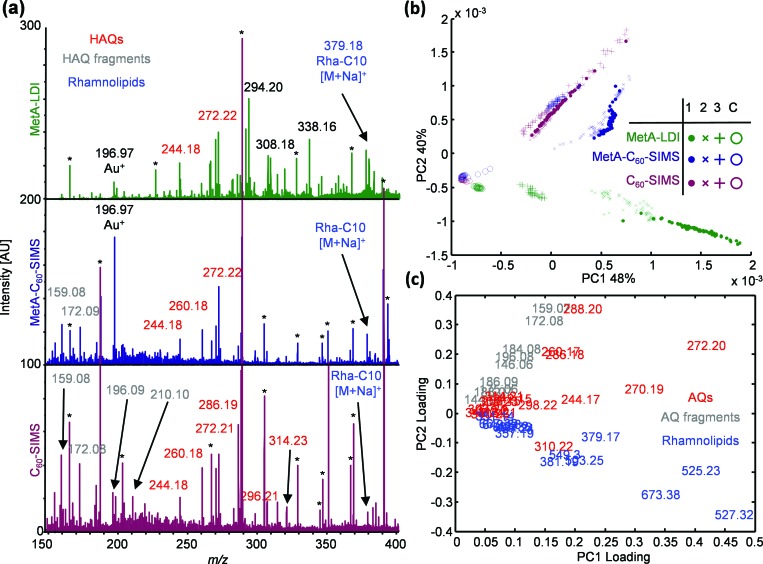
Fig. 4.
(a) Representative spectra for MetA-LDI (green), MetA-C60-SIMS (blue), and C60-SIMS (red) generated by averaging pixels across adjacent imaging rows in biofilm 2; (b) scores plot and (c) loadings plot from targeted PCA of 780 average row spectra from three biofilms 1 (•), 2 (×), and 3 (+), and the media control C (O). Ions marked by an asterisk (*) in (a) are also found in the control sample.

