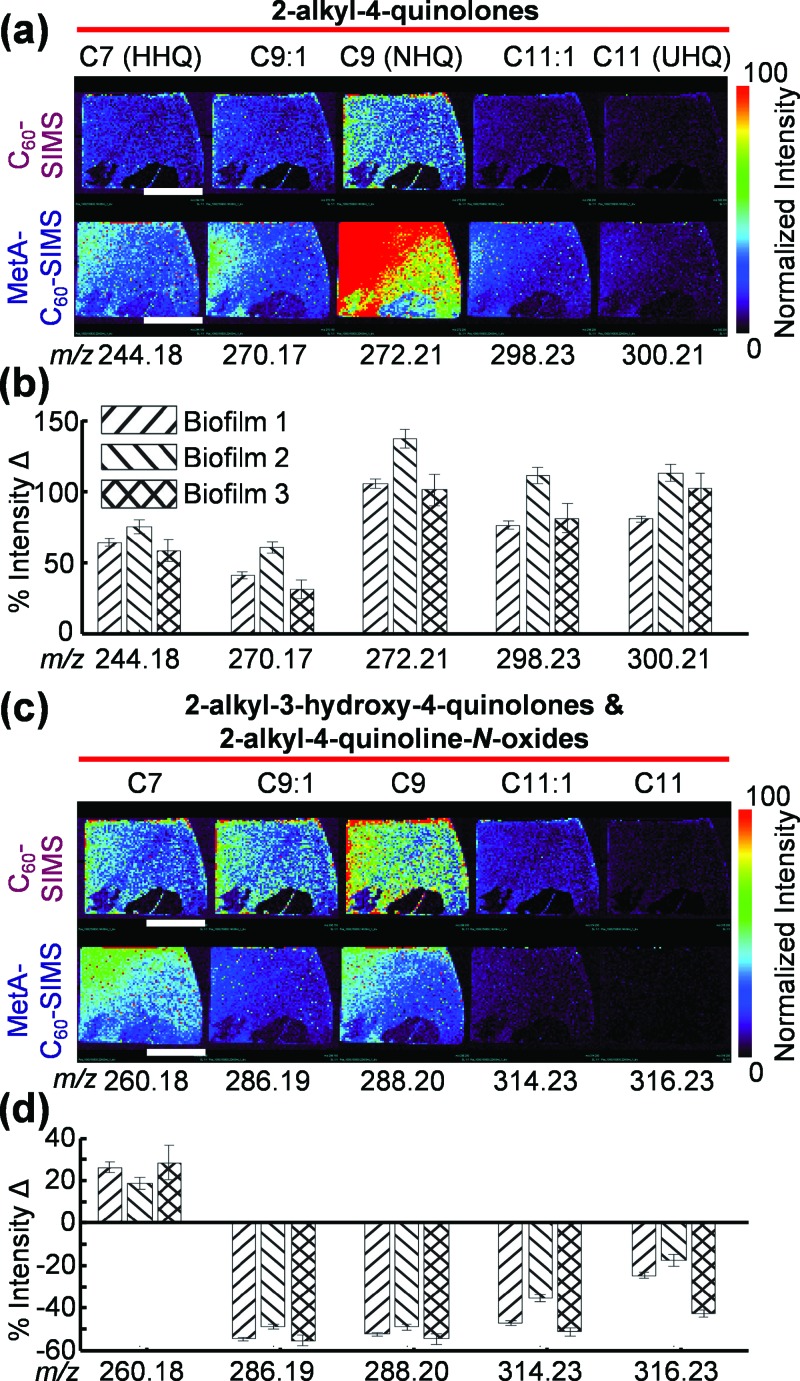
Fig. 5.
C60-SIMS ion images for AQs in biofilm 2 and relative intensity changes observed for the three samples before and after the application of gold. (a) and (b) 2-alkyl-4-quinolones, (c) and (d) combined 2-alkyl-3-hydroxy-4-quinolones and 2-alkyl-4-quinoline-N-oxides. Each bar on the graph depicts the intensity change for a single ion over a biofilm and the error was calculated as standard error of the mean with n = 61, 58, and 56 for biofilms 1, 2, and 3, respectively. The white scale bar represents 1 cm.

