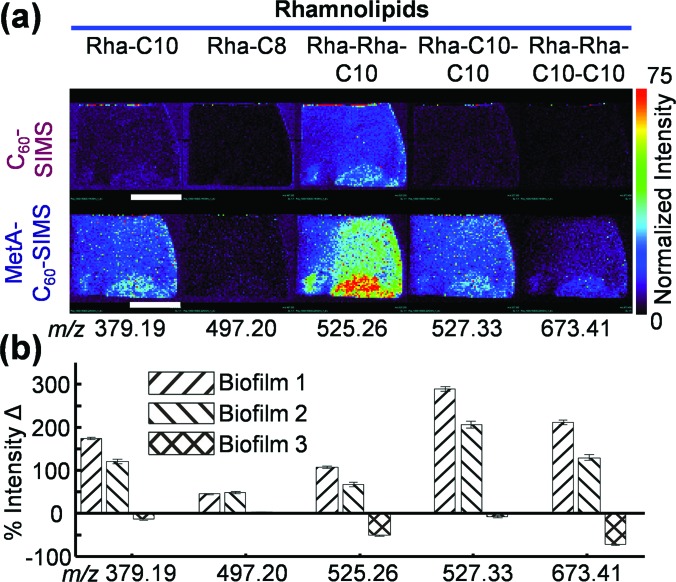
Fig. 7.
(a) RHL ion images for biofilm 2 and (b) relative abundance change for all three biofilms before and after the application of 2–3 nm gold. Each bar on the graph depicts the intensity change for a single ion in a single biofilm and the error was calculated as standard error of the mean with n = 61, 58, and 56 for biofilms 1, 2, and 3, respectively. The white scale bar in (a) represents 1 cm.

