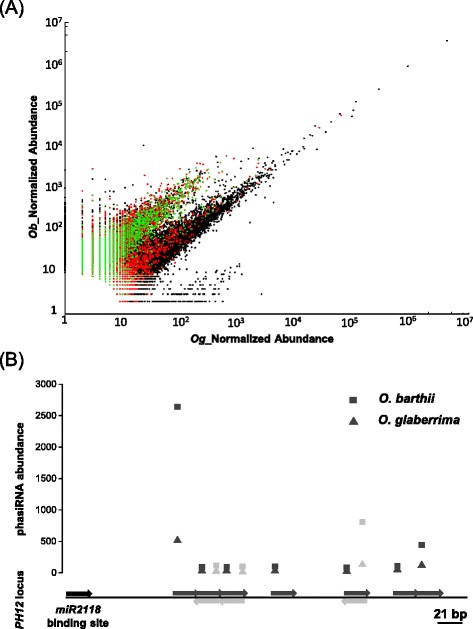
Fig. 1.

Relative abundance of panicle-derived 21-nt small RNAs from O. barthii and O. glaberrima. a Relative abundance of 21-nt small RNAs between O. barthii (Ob) and O. glaberrima (Og). Normalized abundance of distinct small RNA sequences. Black dots represent global 21-nt small RNAs, red dots unannotated 21-nt small RNAs, and green dots 21-nt small RNAs associated with detected phased loci. b Relative abundance of detected phasiRNAs generated from a single locus (PH-12) between O. barthii and O. glaberrima. The lower panel illustrates the position of the miR2118 binding site and the detected phasiRNAs from the PH12 locus in the two species (above or below the line if originating from plus or minus strand respectively). The upper panel illustrates the abundance of the corresponding phasiRNAs in O. glaberrima (triangles) and O. barthii (squares). The abundances of reads from the plus strand are in dark grey, and reads from the minus strand are in light grey
