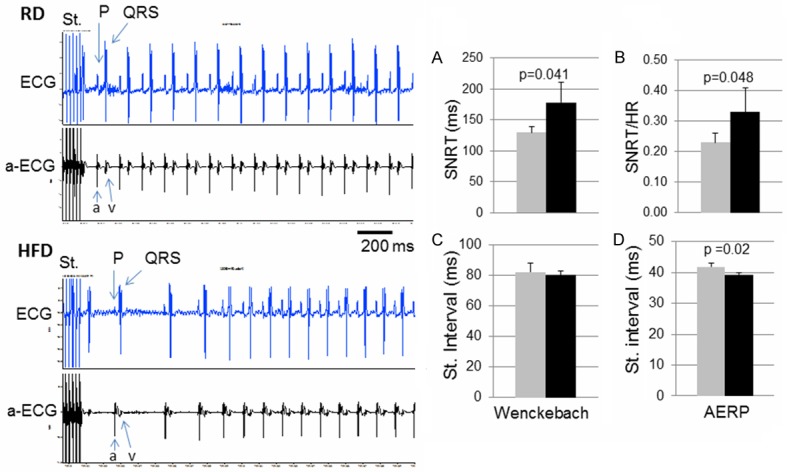
Figure 3.

Responses to atrial stimulations. The left panel: Raw recording tracings of responses in surface ECG and atrial ECG following atrial stimulation (St.) bursts, in a RD mouse (top) and a HFD mouse (bottom). In the atrial ECG, “a” indicates atrial activity and “v” indicates ventricular activity. (A and B) the SA node recovery time (SNRT) (A) or normalized SNRT by heart rate (B) following atrial stimulation. (C and D) the stimulation p-p interval value that induced a Wenckebach AV block (C) or that revealed the atrial effective refractory period (AERP) (D). Data were presented as mean ± SD. In the diagrams, grey bars represent RD group and black bars represent HFD group. In each group, n=5.
