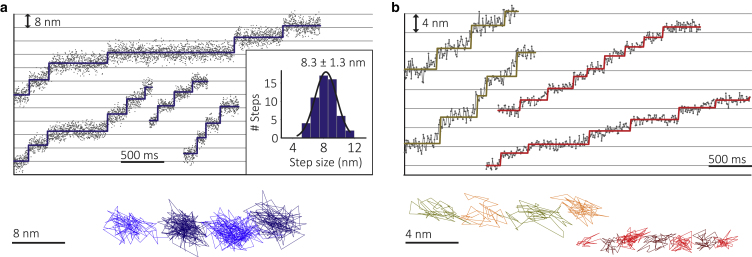
Figure 2.
Analysis of MT motion driven by surface-bound kinesin. (a) Representative time traces showing 8 nm steps for MTs bound to single kinesins, including a representative xy trajectory acquired at 1000 frames/s. (b) Tracking results for higher motor densities exhibiting smaller but distinct fractional steps, including representative xy trajectories acquired at 100 frames/s. To see this figure in color, go online. (corrected)

