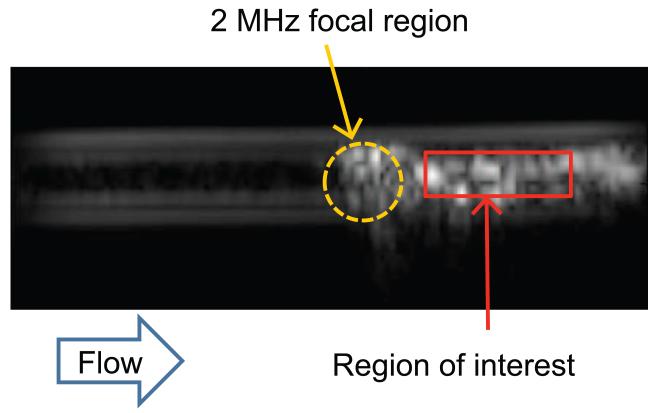
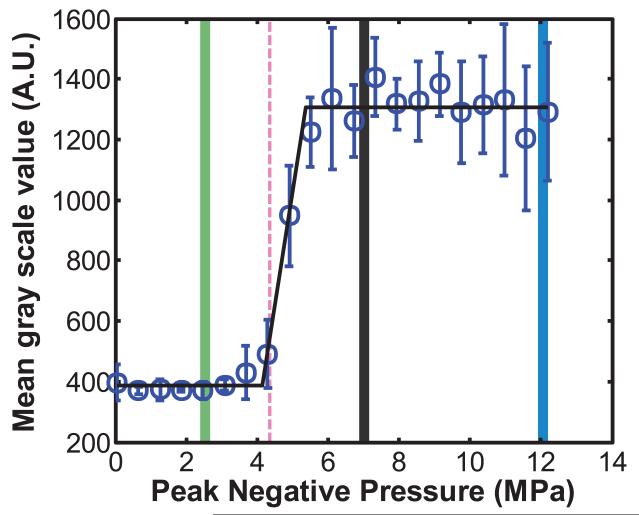
Figure 2. Determination of the acoustic droplet vaporization threshold.
(a) B-mode image of EVA tubing containing PFP droplets exposed to 4.9 MPa peak rarefactional pressure ultrasound pulses. The mean gray scale value within the region of interest demarcated in red was quantified as the downstream echogenicity after ADV. (b) A linear piece-wise function (black line) was fit to the mean gray scale values. The ADV threshold was defined as the pressure where the first two lines of the piece-wise function intersected. The threshold pressure is indicated by the dotted line. The pressures indicated by the green, gray, and blue bars at 2.5 MPa, 7.3 MPa, and 12.2 MPa were used in subsequent experiments to measure changes in DO in the fluid induced by ADV.


